
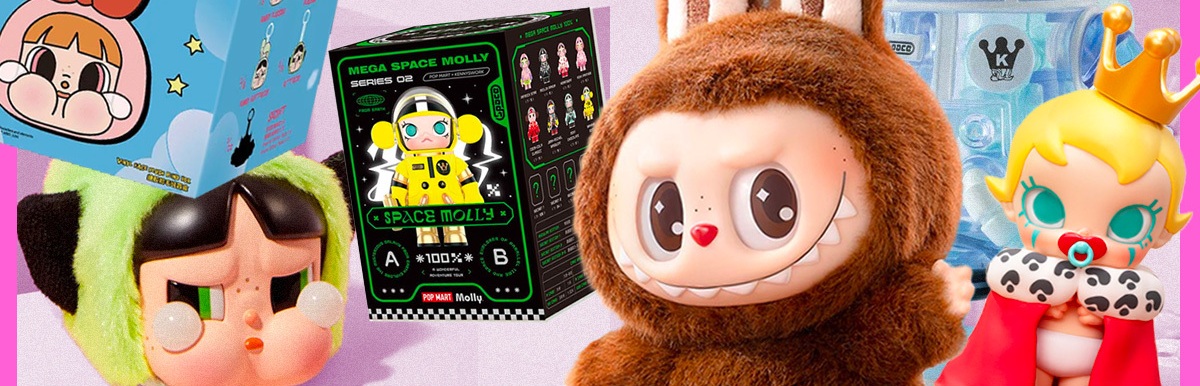
Pop Mart Deep Dive

Company History & Business Evolution
Study Pop Mart's founding story, key milestones, business model evolution from a general retail store to an IP-driven blind box platform, major turning points, and how the company's strategy has evolved over time.
Trace the history of Pop Mart from its founding in 2010 to today: key milestones, pivots in business model, how the blind box format was discovered and scaled, the role of key IPs (Molly, Labubu, etc.), the IPO journey, and the evolution from a domestic Chinese retailer to a global IP platform.
Pop Mart International Group: Corporate History 2010–2026
Executive Summary
Pop Mart (9992.HK) was founded in November 2010 as a lifestyle variety retailer in Beijing. A near-existential crisis with its Japanese distributor Sonny Angel in 2015 forced a full pivot to proprietary IP-based designer toys, crystallized by a January 2016 Weibo post that led to the Molly licensing deal. The blind box format was adopted as a distribution mechanism — not the core product — and scaled from RMB 158 million in revenue (2017) to RMB 1.68 billion (2019) before the December 2020 Hong Kong IPO raised approximately USD 590–676 million. By 2025, overseas revenues exceeded 43% of total, total revenue reached RMB 37.12 billion (+185%), and the company now describes itself as "a world-leading IP platform" with 630 retail stores across 20+ countries.
1. Founding and Early Variety Retail Phase (2010–2015)
Wang Ning (born 1987, Henan) incorporated Beijing Pop Mart on October 20, 2010, using approximately RMB 200,000 raised from selling a university "grid shop" (格子铺) business.1 The first store opened in November 2010 at Zhongguancun's OuMei Hui Shopping Center in Beijing. The concept was modeled on Hong Kong's LOG-ON lifestyle format — a curated variety store — not toys specifically.1
By 2014, Pop Mart had opened ~10 stores including a flagship at APM Shopping Center. Angel investment from Mai Gang (麦刚) in 2012 — after the company had nearly collapsed — was the first external financing.1 Si De (future COO, Peking University MBA classmate of Wang Ning) joined in 2015 and began formalizing the product strategy pivot.
The strategic vulnerability of this phase was laid bare in 2015: Sonny Angel, a Japanese blind-box figurine by Dreams Inc., occupied one-thirtieth of floor space but generated approximately one-third of single-store revenue.1 When Dreams Inc. rejected all expansion requests — additional distribution rights, special editions, trade show participation — the dependency became a strategic crisis. Wang Ning later compared this moment directly to Phil Knight's experience with Onitsuka Tiger in Shoe Dog: the distributor relationship forced creation of proprietary IP.1
2. The Molly Discovery and Blind Box Pivot (2016)
The decisive moment was a Weibo post in January 2016, in which Wang Ning asked followers what collectible characters they loved beyond Sonny Angel.2 "Molly" — created in 2006 by Hong Kong designer Kenny Wong (王信明) — dominated the replies. Wang's team visited each mentioned IP designer, with Kenny Wong ranking highest in fan enthusiasm.2
Pop Mart's pitch to Kenny Wong: his Molly sold a few hundred units annually at premium price; Pop Mart could industrialize production to one million units per year at accessible price points using its existing retail distribution. The deal ultimately granted Pop Mart exclusive licensing rights: initial exclusive China licensing agreement signed 2016; China IP rights formally acquired July 2018; global IP rights acquired April 2019 (per IPO Prospectus).2 Kenny Wong subsequently received a 2% equity stake in Pop Mart, valued at approximately USD 127 million at the time of the IPO.1
"We posted on Weibo asking what figurines people liked, and Molly dominated the replies. We then went to visit each IP artist one by one." — Wang Ning (founder interview)
The first Molly Zodiac Series blind box launched mid-2016 and reportedly sold out within seconds on Tmall. [Note: the "4-second" figure appears in multiple secondary sources but has not been independently confirmed in the IPO Prospectus primary text — treat as indicative, not audited.1]
Following the Molly launch, Wang Ning executed the company's defining strategic bet: cutting essentially all non-toy SKUs. The rationale: variety retail could not compete online (no price or channel advantage, enormous inventory complexity), while focused IP-driven merchandise had dramatically better unit economics and brand-building potential.2
The blind box mechanism: Wang Ning has explicitly stated the blind box is not the core business model — it is a "retail entertainment" (零售娱乐化) mechanism, analogous to discounts. Standard series: 12 designs per series plus one hidden edition (probability 1:144); identical packaging drives the surprise effect and repeat-purchase behavior until a full set is collected.2 Pop Mart popularized both the terms "blind box" (盲盒) and "trendy toy" (潮玩) in China starting in 2016.
The "record label" model: Wang Ning articulated Pop Mart's platform identity: "We are like a record label. Artists before us were like 18th-century concert performers — selling expensive tickets to dozens of people. A record label records and distributes music globally. We did the same for art."2 Industrial molds cost RMB 1–2 million each; individual artists could not afford them. Pop Mart's structural contributions: (i) industrial-scale manufacturing infrastructure; (ii) existing retail distribution network; (iii) market repositioning from male collectors to female consumers.2
3. Channel and Organizational Build-Out (2016–2019)
Key corporate milestones:
June 18, 2016: Converted to joint-stock company (股份有限公司) in preparation for public listing.1
March 8, 2016: Paqu (葩趣) social/community platform incorporated.3
January 25, 2017: Listed on NEEQ (New Third Board), ticker 870578. Wang Ning's stated goal: operational standardization, not capital raising.1
January 27, 2017: Pop Mart Hong Kong Ltd incorporated — first dedicated overseas operational entity.3
2017: First Beijing International Pop Toy Show (BTS) hosted.1
2017: First Robo Shop (unmanned vending kiosk) launched in CJ Cinema networks.4
2018: Shanghai International Pop Toy Show — Asia's largest pop toy exhibition by attendance (Frost & Sullivan).1
March–April 2019: NEEQ delisting completed. Wang Ning explicitly rejected A-shares ("we don't want to profit from speculation") and US listing (time-zone concerns).1
October 31, 2019: Sequoia Capital China purchased USD 80 million of existing shares.1
2019: Retail store count reached 100; Robo Shop count reached 800.14
2019: THE MONSTERS/Labubu formally licensed from Kasing Lung and How2Work.1
Revenue scaling — validation of the IP platform model:5
Metric | FY2017 | FY2018 | FY2019 |
|---|---|---|---|
Revenue (RMB million) | 158.1 | 514.5 | 1,683.4 |
YoY growth | — | +225% | +227% |
Gross margin | 47.6% | 57.9% | 64.8% |
Same-store sales growth | — | +59.6% | +63.1% |
Blind box as % of revenue | 57.8% | 69.9% | 80.7% |
IP structure at IPO (June 2020): 93 IPs — 12 proprietary (full ownership), 25 exclusive (licensed exclusively), 56 non-exclusive (Disney, Universal, Hello Kitty, etc.).2 The company's stated strategy was to progressively shift toward proprietary and exclusive IP to improve margin and reduce licensor dependency.
4. The IPO Journey (December 2020)
Pre-IPO financing: Total new-share issuance across pre-IPO rounds raised approximately USD 68.3 million. Key investors included Sequoia Capital China (4.96% stake at IPO), China Renaissance (Huaxing Growth Capital III), Loyal Valley Capital (~USD 87.5 million total new + secondary), and How2Work Holding (Kasing Lung-associated). Total capital raised including secondary share purchases estimated at approximately RMB 958 million across 8 rounds (source: China Daily; not independently verified against the prospectus financing history table).1
IPO mechanics (December 11, 2020, HKEX: 9992):
Offer price: HK$38.50 (top of HK$31.50–38.50 range)
Opening price: HK$77.10 (+100.3% premium)
Retail tranche oversubscribed: 356 times
Net proceeds: approximately HKD 4.57 billion; Reuters reports approximately USD 676 million including over-allotment option exercise
Market cap at listing: approximately HKD 95 billion
Wang Ning (age 33) held approximately 43.58% voting rights; became a billionaire on listing day1
Use of IPO proceeds — initial allocation vs. March 2026 reallocation:
Category | Original % | Original Amount (HKD M) | March 2026 Revision |
|---|---|---|---|
Channels & overseas expansion | 30% | 1,370.6 | Increased (received IP funds) |
Investment / M&A / alliances | 27% | 1,233.6 | Scope expanded to include theme parks |
Technology / digital / marketing | 15% | 685.3 | Partially redirected to working capital |
IP library expansion | 18% | 822.4 | HKD 563M fully redirected to overseas + theme park |
Working capital | ~10% | 456.9 | Increased |
As of March 25, 2026, approximately 66.5% of IPO proceeds had been deployed. The reallocation of IP acquisition funds signals: (a) self-developed IP has matured, reducing need for third-party IP acquisition; (b) overseas expansion and entertainment (theme parks) have become the primary capital allocation priority.1
5. Labubu: Origin, Licensing, and the 2024 Global Viral Moment
Origin: Kasing Lung (born 1972, raised in Utrecht, Netherlands) created "The Monsters" characters — including the elf-like Labubu with jagged teeth and pointed ears — inspired by Nordic folklore. Characters first appeared under How2Work circa 2015. Pop Mart's formal licensing partnership was concluded in 2019 (initial contact/exploration: ~2018).1 Product development required approximately two years before commercial launch.
FY2024 IP milestones: For the first time, four IPs each crossed RMB 1 billion in annual revenue: THE MONSTERS (>RMB 3 billion), MOLLY, SKULLPANDA, and CRYBABY. CRYBABY was the fastest new IP to reach the RMB 1 billion threshold. 13 IPs in total exceeded RMB 100 million.6
April 2024 — viral inflection point: Blackpink member Lisa posted an Instagram Story showing a giant Labubu doll to approximately 106 million followers. This triggered queues and sell-outs from Southeast Asia to North America. Celebrity adopters followed: Rihanna, Dua Lipa, Kim Kardashian.1
FY2025 scale: THE MONSTERS generated RMB 14.16 billion (+365.7%) — joining the "RMB 10 billion IP club."7
"THE MONSTERS迎來了十週歲生日,LABUBU火爆全球,真正意義上成為了世界級的超級IP。THE MONSTERS收入踋入百億俱樂部,全年實現營收141.6億元,同比增長365.7%。我們認為LABUBU像一個金礦,其價值挖掘才剛剛開始。" — FY2025 Annual Report Chairman's Statement7
In FY2025, THE MONSTERS participated in Macy's Thanksgiving Day Parade (noted as the first trendy toy IP in the parade's 100-year history) and launched a 10th anniversary global tour exhibition in Shanghai.8
6. Evolution to a Global IP Platform (2022–2026)
Revenue and portfolio progression:
Metric | FY2024 | FY2025 | H1 2026 |
|---|---|---|---|
Total revenue (RMB million) | 13,040 | 37,120 | 17,170 |
YoY growth | +107% | +185% | +23.8% |
THE MONSTERS revenue (RMB M) | ~3,000+ | 14,161 | ~4,450 |
THE MONSTERS share | ~23% | 38.1% | 26% |
Overseas revenue share | 38.9% | 43.8% | 29.0% |
IPs >RMB 1B (annual or H1 run-rate) | 4 | 6 | 6 |
FY2025 IP revenue breakdown:910
IP | FY2025 Revenue (RMB M) |
|---|---|
THE MONSTERS (Labubu) | 14,161 |
SKULLPANDA | 3,540 |
CRYBABY | 2,929 |
MOLLY | 2,897 |
DIMOO | 2,777 |
Twinkle Twinkle (星星人) | 2,056 |
HIRONO | 1,735 |
Channel evolution:
Period | China Retail | China Robo Shops | Overseas Retail | Overseas Robo Shops |
|---|---|---|---|---|
End-2017 | 32 | 43 | 0 | 0 |
End-2019 | 100 | 800 | ~22 distributors | — |
IPO Jun-2020 | 136 | 1,001 | 22 countries (distributors) | — |
End-2023 | 363 | 2,190 | — | — |
H1 2024 | 374 | 2,189 | 92 | 162 |
End-2024 | 431 | 2,189 | 130 (incl. JV) | 192 |
End-2025 | 445 | — | 185 | — |
Jun-2026 | 455 | 2,827 | ~221 | — |
Geographic expansion sequence (Citi Research): East Asia (Japan, South Korea, HK/Taiwan) → Southeast Asia (Singapore, Malaysia, Thailand) → North America → Europe.13 Model shifted from B2B distributors to 100% self-operated DTC stores (exceptions: Singapore, Taiwan, Japan, Thailand under JV structures).13
Localization: Pop Mart customizes by region — different IPs, local artist partnerships, region-specific products. Examples: Labubu as official "Magical Thailand Experience Ambassador"; CRYBABY developed with Thai local artists; Disney, Sanrio, NBA licensed partnerships for market-specific releases.14
Beyond blind boxes (Citi Research, December 2024): Product line has broadened to MEGA collections (large-format premium figures), plush toys (surpassed blind boxes as #1 category in FY2025), building blocks, jewelry (popop brand), and offline IP experiences.15 As IPs gain global recognition, commercial value extension opportunities include licensed merchandise, digital entertainment, and theme parks.15
Pop Land theme park: Opened September 2023 at Chaoyang Park, Beijing. Phase 2 expansion design underway as of H1 2026.1
Sony Pictures / Labubu film: Announced March 2026. Director Paul King (Paddington films) attached. Live-action and CGI combination; early development stage.1
2026 H1: Wang Ning characterized 2026 as an "adjustment year." THE MONSTERS revenue share fell to 26% (from 38% in FY2025). Twinkle Twinkle (星星人) grew +580.6% to RMB 2.65 billion as the fastest-growing new IP.1617 Share buyback program of RMB 2–5 billion announced; no interim dividend declared.
Wang Ning on IP patience:18
"你想想molly今年20年了,拉布布11年了。然后那一个IP我们是一个IP也好,一个业务也好,它是需要很慢慢的孵化的一个过程。我们不可能说好今天推一个新的IP或新的业务,就要颠覆传统业务,或者就要一下子就得要抗原来主流的这些大IP。"
The company's stated ambition has evolved from "China's Disney" (circa 2020) to "the world's Pop Mart" (Wang Ning, 2024–2025).1
IP Platform Self-Description
Pop Mart's FY2025 Annual Report characterizes the company as having "a mature full-link ecosystem" for IP incubation: identifying artists and designers with global potential, applying a "differentiated operation strategy" for each IP based on its unique expression, and systematically extending IP commercial value across product formats and geographic markets.19 Artist IP revenue share rose from 85.3% of total in FY2024 to 90.0% in FY2025, as non-exclusive licensed IP contracted.9
Information Limitations and Pending Conflicts
Limitations:
FY2020/FY2021/FY2022 annual reports are not in the local database; post-IPO data for those years relies on secondary sources.
Pre-IPO "8 rounds / RMB 958 million" total (CONFLICT-6): sourced from China Daily (secondary); cross-verification against IPO Prospectus financing history table recommended.
Tmall "4-second sellout" (CONFLICT-4): widely cited in secondary sources; not independently confirmed in the IPO Prospectus or founder interview primary text.
SKULLPANDA artist background and discovery narrative: not documented in available local files.
Pending conflicts from reconciliation:
Conflict | Description | Recommended Reading |
|---|---|---|
C-3 (HIGH) | Molly IP rights dates: 2016 China initial license vs. 2019 global rights frequently conflated | Base: initial exclusive China licensing 2016; China rights July 2018; global rights April 2019 (per prospectus) |
C-2 (HIGH) | "105 overseas stores" in H1 2026 = gross openings, not net additions | Net additions H1 2026: approximately 36 |
C-7 (MEDIUM) | Labubu licensing year: 2018 exploration vs. 2019 formal deal | Wiki SSOT anchor: formal licensing = 2019 |
C-4 (LOW) | "Tmall 4 seconds" — secondary source only | Treat as indicative, not audited |
C-6 (LOW) | Pre-IPO "8 rounds / RMB 958M" — secondary source | Cross-check against prospectus recommended |
Business Model & Unit Economics
How Pop Mart makes money, IP flywheel, channel mix, pricing power, and unit economics
How does Pop Mart's business model work? Analyze the IP flywheel, channel mix, pricing strategy, and unit economics.
Pop Mart Business Model: IP Flywheel, Channel Mix, Pricing Strategy, and Unit Economics
Executive Summary
Pop Mart (9992.HK) operates as a vertically integrated IP platform that scouts global artists, industrializes their characters into physical collectibles via a proprietary blind box format, and sells exclusively through its own direct-to-consumer channels. The business generates high and expanding margins — gross margin reached 72.1% in FY2025, net margin 35.1% — through three compounding factors: overseas geographic mix (higher-ASP markets), rising proprietary IP concentration (90% artist IPs by revenue), and operating leverage on a fixed-cost store base. The most structurally significant recent fact is that plush toys (primarily LABUBU/THE MONSTERS) became the single largest product category at 50.4% of FY2025 revenue (+560.6% YoY), demonstrating the IP flywheel's capacity to reshape the product mix entirely within one product cycle.
Key Finding 1: The IP Flywheel — Three-Channel Sourcing, Patient Incubation, and a Self-Reinforcing Platform
Pop Mart's core engine is an IP platform that does for collectible artists what a record label does for musicians: it funds industrial-scale production (steel molds cost RMB 1–2 million each, unaffordable for individual artists), provides manufacturing and distribution infrastructure, and reaches a mass consumer base no individual artist could access alone.20
Three sourcing channels feed the flywheel:21
External artists — An internal artist-discovery team scouts globally at toy exhibitions, design competitions, and art school partnerships. Artists are evaluated on first-hand market feedback (from stores and the Paqu app), fan base size, and professional judgment. Agreements are structured as IP transfer or exclusive license.
PDC (Pop Design Center) — The in-house originals studio that incubated HIRONO, Zsiga, Nyota, and inosoul. In FY2024, HIRONO achieved 106.9% YoY revenue growth; CRYBABY grew 1,537.2% YoY in 2024 on its "Healing Through Tears" emotional narrative.22
Licensed IPs — Non-exclusive arrangements with Disney, Universal Studios, Sanrio, etc. Licensed IP revenue was RMB 3,382.0 million in FY2025, representing 9.1% of total (down from 12.3% in FY2024).23
Incubation is deliberately long-horizon. CEO Wang Ning at the 2026 AGM stated: "你想想molly今年20年了,拉布布11年了。然后那一个IP我们是一个IP也好,一个业务也好,它是需要很慢慢的孵化的一个过程。" (MOLLY is 20 years old; LABUBU is 11 years old. An IP takes a very slow incubation process.)24
The flywheel is self-reinforcing:25 strong IP execution attracts better artists → more IPs incubated → stronger sales data from proprietary retail channels → better IP selection decisions → higher artist IP concentration. Artist IPs rose from 81.0% of H1 2024 revenue to 88.1% in H1 2025 and 90.0% for FY2025 full year.2326
IP diversification trajectory:
Year | IPs > RMB 1 billion | IPs > RMB 100 million |
|---|---|---|
FY2023 | 0 | 10 |
FY2024 | 4 | 13 |
FY2025 | 7 (est.) | 17 |
In FY2024, four IPs — THE MONSTERS, MOLLY, SKULLPANDA, CRYBABY — each exceeded RMB 1 billion for the first time.27 In FY2025, THE MONSTERS alone generated RMB 14,161.1 million (+365.7% YoY, 38.1% of total revenue), SKULLPANDA RMB 3,539.5 million (9.5%), CRYBABY RMB 2,929.0 million (7.9%), MOLLY RMB 2,897.1 million (7.8%), DIMOO RMB 2,776.7 million (7.5%).23
Wang Ning's core identity statement: "We are essentially an art company, but use commercial means to promote it... IP can increase the value of many product categories — a transparent cup sells for RMB 5; print MOLLY on it and it sells for RMB 10."28
Key Finding 2: Productization — Blind Box Mechanics Multiply IP Value Across Formats
The blind box is the primary productization engine. Each series contains 12 standard designs in identical packaging, plus one "hidden edition." The probability of a regular variant is 1:12; the hidden edition is 1:144. The uniform packaging means a consumer cannot know which design they receive until opening — driving repeat purchase behavior until the desired figure is obtained or the full set is complete.29
This mechanic creates a consumption loop: purchase → reveal → repeat (to complete set or obtain hidden variant) → secondary-market engagement (rare variants trade at multiples of retail; Pop Mart does not control secondary prices but acknowledges they reinforce scarcity perception).30
The productization ladder extends upward from blind box:
Standard blind box (7–8 cm vinyl figures) — base product at RMB 59–99
Limited / themed series — collector premium within same price tier
MEGA Collection: "400%" = 4x standard height; "1000%" = 10x standard height31
Plush variants — the most dramatic recent expansion
Lifestyle / accessories, jewelry (POPOP line launched Jan 2025)
Experiential: POP LAND theme park (Beijing, opened Sep 2023), art exhibitions, mobile game Dream Home (launched Jun 2024)32
Product category revenue shift (FY2023–FY2025):
Category | FY2024 | FY2025 |
|---|---|---|
Figure toys | 53.2% | 32.4% |
Plush toys | 21.7% | 50.4% |
MEGA Collection | 12.9% | 5.2% |
Other IP products | 12.2% | 12.0% |
Sources: FY2024 AR, FY2025 AR3334
Plush category revenue reached RMB 18,708.1 million in FY2025 (+560.6% YoY from RMB 2,832.1 million in FY2024).33 This reflects the IP flywheel in operation: THE MONSTERS/LABUBU IP was extended from vinyl figure format into a plush accessory with different costumes and interactive features, capturing a broader (and more female-skewed) consumer segment.32
Key Finding 3: Channel Mix — Fully DTC, Omnichannel, With Distinct Regional Structures
Pop Mart describes its model as Direct-To-Consumer (DTC): no third-party retail intermediaries, no franchise model, all stores directly operated. This contrasts with peers such as MINISO's TOP TOY brand (franchise model) and Bandai's multi-brand wholesale approach.35 Definitional note: the FY2024 annual report explicitly states overseas store counts include those "operated by joint venture" (130 stores) and roboshops "including those operated by joint venture and roboshop partners" (192 units)36 — meaning Pop Mart's "DTC" encompasses JV-operated units in addition to wholly-owned stores.
Mainland China FY2025 channel breakdown:
Channel | Revenue (RMB M) | % of PRC | YoY |
|---|---|---|---|
Offline — Retail Stores | 10,075 | 48.3% | +119.0% |
Offline — Roboshops | 1,346 | 6.5% | +79.3% |
Online — Pop Draw (Mini Program) | 3,424 | 16.4% | +207.4% |
Online — Tmall Flagship | 1,785 | 8.6% | +184.4% |
Online — Douyin | 1,590 | 7.6% | +164.4% |
Online — Other | 1,724 | 8.3% | +301.6% |
Wholesale and Others | 908 | 4.3% | +19.0% |
PRC Total | 20,852 | 100% | +134.6% |
Overseas channel structure is materially different. In the Americas, online revenue represented 64% of segment revenue in FY2025 (official website/app 42.2%, TikTok 15.3%), with offline at only 32.8%.37 This reflects Pop Mart's go-to-market sequence in new markets: online and social virality first, physical stores as brand deepening second.
China city-tier store distribution (FY2024):38
City Tier | Stores | Store Revenue (RMB M) | Roboshops | Roboshop Revenue (RMB M) |
|---|---|---|---|---|
Tier-1 (BJ/SH/GZ/SZ) | 125 | 1,495.9 | 622 | 201.1 |
New Tier-1 | 116 | 1,096.1 | 694 | 217.7 |
Tier-2 and other | 160 | 1,235.8 | 984 | 279.7 |
Total | 401 | 3,827.9 | 2,300 | 698.4 |
Revenue is broadly distributed across city tiers — no megacity concentration.
Global footprint progression:
Period | China Stores | Overseas Stores | Global Roboshops |
|---|---|---|---|
FY2023 | 363 | ~80 | ~2,190 |
FY2024 | 401 | 130 (incl. JV) | 2,492 total |
FY2025 | 445 | 185 (19 countries) | 2,637 |
The membership system is a key operating asset: 72.58 million registered mainland China members at end-FY2025 (up from 46.08 million at end-FY2024), contributing 93.7% of total sales, with a repeat purchase rate of 55.7% (vs. 49.4% in FY2024).39 In H1 2025, 13.04 million new members were added in 6 months.40
Key Finding 4: Pricing Strategy — Tiered Architecture, Engineered Scarcity, and Geographic Premium
Official price tiers (from IPO Prospectus):
Product Format | Size | Price Range (RMB) |
|---|---|---|
Standard Blind Box | 4.5–9.5 cm | 49–99 |
Figure Toys | 10–20 cm | 199–1,499 |
BJD | Various | 399–799 |
Derivative Products | Various | 6–389 |
MEGA 400% | ~28 cm | ~RMB 400 / USD 60–70 |
MEGA 1000% | ~70 cm | USD 200+ |
The MEGA Collection's pricing vocabulary — "400%" and "1000%" — refers to height multiples of the 7–8 cm standard figure. Wang Ning: "现在这种体系和语言会渗透到我们很多的产品和业务线当中." (This system and language will permeate many of our products and business lines.)31
Scarcity as structural pricing tool. Wang Ning's "七分饱" (70% full) philosophy intentionally under-supplies the market to preserve perceived uniqueness.42 Geographic exclusives (THE MONSTERS from the Louvre, DIMOO from Australia, CRYBABY from Thailand, DIMOO from North America) create location-specific scarcity, driving tourist purchase behavior.43
International pricing premium is the primary mechanical driver of gross margin expansion. International retail prices are approximately 1.5–2x China ASP (standard blind box: USD 12.99–15 in the US vs. RMB 59–99 in China), and the overseas mix rose from 9.8% (FY2022) to 38.9% (FY2024) to 43.8% (FY2025).4445
Promotions. During 618 2024, Pop Mart topped both the Tmall Overall Toy Ranking and the Tmall Pop Toy Ranking. Tmall Flagship Store generated RMB 627.8 million in FY2024 (+95.0% YoY).46 Festival promotions temporarily compress ASP but drive H2-weighted revenue concentration.
Key Finding 5: Unit Economics — Expanding Margins, Low CAC, Asset-Light Cash Machine
P&L cascade (FY2022–FY2025 + H1 2025):
Period | Revenue (RMB bn) | Gross Margin | D&S % Rev | G&A % Rev | Op Margin | Net Margin |
|---|---|---|---|---|---|---|
FY2022 | 4.62 | 57.5% | ~43% | — | ~13% | ~10% |
FY2023 | 6.30 | 61.3% | ~32% | — | ~19.5% | 17.2% |
FY2024 | 13.04 | 66.8% | 28.0% | 7.3% | 31.9% | 25.4% |
H1 2025 | 13.88 | 70.3% | 23.0% | 5.6% | 43.5% | 33.7% |
FY2025 | 37.12 | 72.1% | 21.8% | 4.8% | 45.5% | 35.1% |
Sources: FY2024 AR, FY2025 AR, H1 2025 Interim Report474849
Three compounding gross margin drivers (confirmed explicitly in management commentary both FY2024 and FY2025):4445
Overseas mix uplift — International channels carry 1.5–2x China ASP at comparable production cost. Overseas mix: 9.8% (FY2022) → 38.9% (FY2024) → 43.8% (FY2025).
Proprietary IP concentration increase — Declining proportion of externally-procured products (which carry lower margins) explicitly cited in both FY2024 and H1 2025 management commentary.50
Supply chain leverage — Centralized procurement, stronger supplier bargaining, flexible supply chain strategy.45
COGS decomposition (FY2024 vs. FY2025):
Cost Item | FY2024 (RMB M) | FY2025 (RMB M) | % of FY2025 Revenue |
|---|---|---|---|
Inventory / goods cost (COGS) | 3,474 | 8,507 | 22.9% |
Design & licensing cost (COGS) | 507 | 951 | 2.6% |
License fees (opex, Note 7) | 393 | 833 | 2.2% |
Total IP-related costs | ~900 | ~1,784 | ~4.8% |
Employee benefits (total) | 1,462 | 2,252 | 6.1% |
Commissions & e-commerce fees | 614 | 1,438 | 3.9% |
Advertising & marketing | 568 | 1,194 | 3.2% |
Transportation & logistics | 543 | 2,043 | 5.5% |
Lease (ROU dep. + variable) | 910 | 1,931 | 5.2% |
Sources: Note 7, FY2024 AR and FY2025 AR5152
Important: The two IP cost lines represent inbound costs Pop Mart pays to artists and licensors. This is separate from outbound licensing revenue, which is only ~0.19% of total revenue. Pop Mart is a net licensee-payer, not a net licensor.53
Operating leverage quantified. D&S expenses grew 121.4% in FY2025 vs. revenue growth of 184.7% — D&S as a percentage of revenue fell 620 bps from 28.0% to 21.8%. G&A grew 86.9% vs. revenue +184.7%, falling 250 bps from 7.3% to 4.8% of revenue.54
Membership as low-CAC, high-LTV mechanism. Advertising and marketing spend fell from 4.4% of FY2024 revenue to 3.2% of FY2025 revenue — declining as the brand scales. Member sales represent 93.7% of FY2025 total sales at 55.7% repeat purchase rate and 72.1% gross margin per transaction.3951
Per-store unit economics (Citi Research, 2020–2023):55
China retail stores: average revenue per store RMB 5.5M–7.2M per year
China roboshops: average revenue per unit RMB 0.18M–0.32M per year
Implied FY2024 roboshop average: RMB 698 million / 2,300 units ≈ RMB 303K per machine
Working capital and balance sheet:
Metric | FY2023 | FY2024 | FY2025 |
|---|---|---|---|
Inventory turnover (days) | 133 | 102 | 123 |
Trade receivable days | 15 | 11 | 7 |
Trade payable days | 53 | 61 | 51 |
Cash (RMB bn) | — | 6.11 | 13.78 |
Bank borrowings | — | 0 | 0 |
Sources: FY2024 AR, FY2025 AR565758
Inventory turnover increased from 102 to 123 days in FY2025, driven by international expansion logistics requirements (longer shipping lead times) and net addition of 109 global stores requiring higher inventory buffers — not attributed to demand weakness per the filing.56 Cash nearly doubled from RMB 6.11 billion to RMB 13.78 billion; zero bank debt.58
Short-term / One-Time Factors and Definition Notes
IP concentration: THE MONSTERS accounted for 38.1% of FY2025 total revenue. Historically, MOLLY reached 42% of revenue in FY2018 before declining to ~7.8% as other IPs matured — providing a reference case for IP lifecycle management.2923
Plush toy share surge: 50.4% of FY2025 revenue is plush (near-zero in FY2022). Future category mix will depend on which IPs break out in subsequent cycles.
Inventory turnover increase (102 → 123 days): Management explicitly attributes this to overseas expansion logistics, not demand weakness.56
Citi Dec 2024 margin forecasts vs. actuals: Citi projected FY2025E GM of 65.5%; actual FY2025 GM was 72.1%. Citi projected net margin of 21.9%; actual was 35.1%. The gap illustrates the speed of Labubu-driven margin acceleration that was not foreseen at the time of initiation.59
DTC definition: Pop Mart's "DTC" encompasses JV-operated overseas stores and roboshop partners, not exclusively wholly-owned units.36
Information Sources, Limitations, and Pending Confirmations
Sources used:
# | File Name | file_id |
|---|---|---|
1 | FY2025 Annual Report | 243137 |
2 | FY2024 Annual Report | 243141 |
3 | H1 2025 Interim Report | 243139 |
4 | IPO Prospectus | 132694 |
5 | Expert Interview (因为独特) | 132695 |
6 | 2026 AGM Transcript | 172402 |
7 | Citi Research Initiation (Dec 2024) | 243571 |
Information limitations:
No per-unit/per-box COGS is publicly disclosed. Pop Mart stopped publishing volume data post-IPO. Per-box contribution margins are not calculable from public filings.
Artist royalty rates are not disclosed in filings. Third-party sources cite 5–15% of net sales but this is unconfirmed.
International segment operating margins are not separately disclosed.
Per-store P&L and capex payback period: management has referenced "2–3 years" for international flagships in secondary media but no formal filing disclosure exists.
FY2022 and prior annual reports not available locally.
IP Portfolio, Challenges & Strategy
In-depth analysis of Pop Mart's IP portfolio composition, IP creation and licensing model, key IP performance, concentration risks, competitive threats, and forward IP strategy including international expansion and new IP development pipeline.
Conduct an in-depth analysis of Pop Mart's IP portfolio covering: (1) IP portfolio composition — owned vs. exclusively licensed vs. non-exclusively licensed IPs, key characters and their revenue contribution history; (2) IP creation model — artist discovery, co-development, licensing economics, royalty structures, and contract terms; (3) IP concentration risk — THE MONSTERS/Labubu dependence (38.1% of FY2025 revenue), historical analogues with MOLLY, and portfolio diversification trajectory; (4) IP challenges — litigation risks (Ty Inc. injunction, other IP disputes), counterfeiting, artist relationship management, and the risk of IP fatigue; (5) forward IP strategy — new IP pipeline (Xingxing Ren, Crybaby, Dimoo trajectory), theme park IP commercialization (POP LAND), entertainment extensions (Sony Pictures Labubu film), and geographic IP adaptation for overseas markets.
Pop Mart (9992.HK): IP Portfolio — Composition, Creation Model, Concentration Risk, Challenges & Forward Strategy
Executive Summary
Pop Mart operates as an IP platform whose revenue is driven by a tiered portfolio of artist and licensed characters, currently numbering 17 IPs exceeding RMB 100 million in annual revenue as of FY202560. The single most material fact in the current IP picture is that THE MONSTERS (Labubu) reached 38.1% of FY2025 total revenue — a peak concentration level comparable to MOLLY's historical high of 42% in FY20186162 — before moderating to 26.0% in H1 2026 as Twinkle Twinkle (Xingxing Ren) surged to 15.4% of group revenue63. Alongside this de-concentration trajectory, Pop Mart faces a first-time preliminary injunction by Ty Inc. targeting its "Pucky Beanie" product line (granted June 8, 2026, N.D. Illinois)64, a 9x escalation in counterfeiting volumes in 202565, and a contested new IP creation model illustrated by the February 2026 KeyA launch failure.
Key Finding 1: Three-Tier IP Classification and the FY2023 Reclassification
At IPO (June 2020), Pop Mart held 93 IPs across three contractual tiers. The foundational framework comprised: (i) proprietary/self-owned IPs — full IP rights, sub-licensable, key examples: MOLLY (acquired 2018-2019), DIMOO, SKULLPANDA, Sweet Bean, Hirono; (ii) exclusive licensed IPs — exclusive rights in specified territories (principally mainland China, HK, Macau, Taiwan), initially 4-year terms extendable to 6+ years upon market performance, sub-licensable within licensed regions — key examples: THE MONSTERS/Labubu (Kasing Lung), PUCKY, CRYBABY, SATYR RORY; and (iii) non-exclusive licensed IPs — non-exclusive regional rights only, 1-2 year terms not automatically renewable, minimum guaranteed royalties, no sub-licensing — key examples: Disney/Mickey Mouse, Universal/Despicable Me, Hello Kitty/Sanrio, NBA66.
From FY2023 onward, Pop Mart consolidated its reporting into a binary framework: "Artist IPs" (= all proprietary + exclusive IPs) and "Licensed IPs" (= non-exclusive). This reclassification reflects the commercial reality that proprietary and exclusive IPs share similar economics and strategic treatment. Readers should treat "artist IP" and "proprietary/exclusive" as equivalent for FY2023+ data.
Table 1: Artist IPs vs. Licensed IPs — Revenue and Share Progression
Period | Total Revenue (RMB m) | Artist IP Revenue (RMB m) | Artist IP Share | Licensed IP Revenue (RMB m) | Licensed IP Share |
|---|---|---|---|---|---|
FY2019 | ~1,683 | ~627 | 37.2% | n/a | n/a |
FY2022 | ~4,621 | 3,640 | 78.9% | 550 | 11.9% |
FY2023 | 6,302 | 4,822 | 76.5% | 1,036 | 16.5% |
FY2024 | 13,037 | 11,121 | 85.3% | 1,601 | 12.3% |
FY2025 | 37,120 | 33,406 | 90.0% | 3,382 | 9.1% |
H1 2026 | 17,173 | 15,290 | 89.0% | 1,771 | 10.3% |
Source: IPO Prospectus (FY2019), FY2023/FY2024/FY2025 Annual Reports, H1 2026 Results Announcement; FY2022 from FY2023 AR comparatives.6667
The FY2019 starting point (37.2% artist IP share) reflects the business being effectively MOLLY-centric at that time. The post-2020 broadening into THE MONSTERS, SKULLPANDA, DIMOO, CRYBABY, and Twinkle Twinkle drove Artist IPs to a 90% share by FY2025 — but within that 90%, concentration has simply shifted from MOLLY to THE MONSTERS62.
Key Finding 2: Individual IP Revenue History — From MOLLY to Labubu to Twinkle Twinkle
Table 2: Key IP Revenue Contributions — Historical Time Series (RMB million)
IP | FY2019 | FY2022 | FY2023 | FY2024 | H1 2025 | FY2025 | H1 2026 |
|---|---|---|---|---|---|---|---|
THE MONSTERS | — | 263 (5.7%) | 368 (5.8%) | 3,041 (23.3%) | 4,814 (34.7%) | 14,161 (38.1%) | 4,454 (26.0%) |
MOLLY | 456 (27.1%) | 802 (17.4%) | 1,020 (16.2%) | 2,093 (16.1%) | 1,357 (9.8%) | 2,897 (7.8%) | 901 (5.3%) |
SKULLPANDA | — | 852 (18.4%) | 1,025 (16.3%) | 1,308 (10.0%) | 1,221 (8.8%) | 3,540 (9.5%) | 1,551 (9.0%) |
CRYBABY | — | — | 71 (1.1%) | 1,165 (8.9%) | 1,218 (8.8%) | 2,929 (7.9%) | 1,633 (9.5%) |
DIMOO | — | — | ~400 est. | ~900 est. | 1,105 (8.0%) | 2,777 (7.5%) | 1,619 (9.4%) |
Twinkle Twinkle | — | — | — | 121 (0.9%) | 389 (2.8%) | 2,056 (5.5%) | 2,650 (15.4%) |
Source: IPO Prospectus, FY2023 AR, FY2024 AR, H1 2025 Interim Report, FY2025 AR, H1 2026 Results; DIMOO FY2023-2024 estimated from broker report.63686970
Three portfolio phases are visible in the data: (1) MOLLY dominance pre-2022; (2) SKULLPANDA/DIMOO/CRYBABY multi-IP broadening 2022-2023; (3) THE MONSTERS surge + Twinkle Twinkle emergence 2024-present. The H1 2026 data — Twinkle Twinkle at RMB 2,650 million approaching 60% of THE MONSTERS' absolute revenue — represents the most significant portfolio rebalancing since MOLLY's initial decline6370.
Twinkle Twinkle's trajectory: signed in 2024, it generated RMB 120.8 million in FY2024 (0.9%), expanded to RMB 2,055.6 million in FY2025 (+16x YoY), and further to RMB 2,650 million in H1 2026 (+580.6% YoY)63. Created by Chinese illustrators Da Xin and A Li (concept: "Stars can't shine without darkness"), originally developed in 2020 and commercially signed by Pop Mart in 2024.
Key Finding 3: IP Creation Model — Artist Discovery, Co-Development, and Licensing Economics
The co-development process has five defined stages totaling approximately 8 months from sketch to market:
Artist submits 2D sketch; Pop Mart refines (~1 month)
Internal industrial design team creates 3D model for artist review (~3 months)
Coloring and packaging design (~1 month)
Mold-making and batch production (~2 months)
Marketing plan development; artist final review (~1 month)
For non-exclusive IPs (Disney, Hello Kitty), the IP provider replaces the artist at every review stage66.
Artist discovery channels include pop toy conventions (booth traffic + product sales as market signals), design competitions, art college partnerships (e.g., Central Academy of Fine Arts), social media monitoring via Pop Mart's Paqu app, and the annual "Insight Artist" program (~100 global artists in the 2024 edition, double the inaugural session)71. The PUCKY case study illustrates the pipeline: Pop Mart signed an exclusive agreement in 2017 with an anonymous Hong Kong female artist identified through exhibitions; first PUCKY "Pool Babies" blind box launched April 2018; limited-edition "PUCKY Xmas Babies" sold 5,000 units in one minute on Tmall Double 11 2018 — a 12-month artist-to-viral-product cycle72.
Table 3: Contractual Structure by IP Category
Dimension | Proprietary/Acquired IPs | Exclusive Licensed IPs | Non-Exclusive Licensed IPs |
|---|---|---|---|
Examples | MOLLY, DIMOO, SKULLPANDA, Hirono | THE MONSTERS, CRYBABY, PUCKY | Disney, Hello Kitty, NBA |
IP ownership | Pop Mart (full) | Artist/creator retains | IP holder retains |
Initial term | Acquired (perpetual) | 4 years | 1-2 years |
Extension | Perpetual | Extendable to 6+ years | Not auto-renewable |
Sub-licensing | Yes | Yes (within licensed territory) | Typically no |
Artist fee | Fixed transfer fee + sales-based design fee (single-digit % annual cap) | Same design fee structure | Royalty with minimum guarantee |
Renewal leverage | Full control | Market performance-based priority renewal | Contingent on IP holder |
Source: IPO Prospectus (2020), FY2024 AR risk factors, FY2025 AR accounting notes, Citi Research broker report (Dec 2024).667374
The royalty accounting policy (FY2025 AR Notes) uses a two-tier structure: fixed minimum payments are capitalized at present value as an intangible asset and license fee payable (current portion RMB 437 million, non-current RMB 5.5 million as of Dec 31, 2025); variable sales-based payments are expensed in the period earned. Amortization of IP rights: RMB 117 million in FY2025 (vs. RMB 113 million in FY2024)73.
Design and license cost scaling confirms royalty obligations are growing in absolute terms but declining as a share of revenue:
Year | Design & License Costs (RMB m) | Group Revenue (RMB m) | Cost as % of Revenue |
|---|---|---|---|
FY2023 | 237 | 6,302 | 3.8% |
FY2024 | 507 | 13,037 | 3.9% |
FY2025 | 951 | 37,120 | 2.6% |
The declining royalty burden (3.9% to 2.6%) alongside gross margin improvement (from ~61% in FY2023 to 72.1% in FY2025) reflects the increasing dominance of high-margin artist IPs74.
Outbound licensing remains deliberately contained. At the May 2026 AGM, CEO Wang Ning re-classified the licensing department under marketing rather than as an independent revenue unit, preferring a "closed iOS ecosystem" approach to protect IP exclusivity over a Disney-style mass licensing model75. Outbound licensing fee income: RMB 43.0 million (FY2023) → RMB 56.7 million (FY2024), representing under 0.2% of total revenue.
Key Finding 4: IP Concentration Risk — THE MONSTERS at 38.1% and the MOLLY Analogue
The MOLLY concentration cycle is the primary historical reference. Per Citi Research (Dec 2024), MOLLY peaked at 42% of group revenue in FY2018, declining to 16% by FY2023 — a 26-percentage-point managed decline over 5 years as SKULLPANDA, DIMOO, and THE MONSTERS ramped up62. MOLLY preserved absolute revenue through sub-IP extensions (Classic MOLLY, Space MOLLY, Angry MOLLY, Royal MOLLY, Baby MOLLY), stabilizing at RMB 1,020 million in FY2023 even as its revenue share halved69.
Table 4: THE MONSTERS/Labubu Concentration Progression
Period | THE MONSTERS Revenue (RMB m) | Share of Total | YoY Growth | MOLLY Share | Twinkle Twinkle Share |
|---|---|---|---|---|---|
FY2023 | 368 | 5.8% | — | 16.2% | — |
FY2024 | 3,041 | 23.3% | +365.7% | 16.1% | 0.9% |
H1 2025 | 4,814 | 34.7% | +668.0% | 9.8% | 2.8% |
FY2025 | 14,161 | 38.1% | +365.7% | 7.8% | 5.5% |
H1 2026 | 4,454 | 26.0% | -7.5% | 5.3% | 15.4% |
Source: FY2025 AR, H1 2025 Interim Report, H1 2026 Results Announcement, H1 2026 Earnings Call.63687076
Key structural differences between the current THE MONSTERS situation and the historical MOLLY cycle (stated as facts; readers should draw their own conclusions):
Scale: MOLLY peaked at approximately RMB 800-900 million before fading. THE MONSTERS peaked at RMB 14.16 billion in FY2025 — approximately 16x MOLLY's peak — meaning a proportional revenue decline translates to a substantially larger absolute revenue impact.
Ownership: MOLLY is a proprietary/acquired IP (Pop Mart owns it outright). THE MONSTERS is an exclusive licensed IP — Kasing Lung retains IP ownership. The exclusive agreement's original term implied renewal milestones around FY2023-2024 and again by FY2027-2029. Specific renewal terms are not publicly disclosed.
H1 2026 reversal: THE MONSTERS registered its first absolute YoY revenue decline (-7.5% to RMB 4,454 million)70. Management framed this as healthy "IP de-single-concentration taking effect" (IP去单一化见效)76.
IP lifecycle policy: Pop Mart's accounting estimates expect major IP lifecycles to exceed 10 years (owned IPs amortized over 10-30 years, licensed IPs over 2-10 years)77. Labubu was created in 2015 — it is 11 years old as of 2026.
Management's stated portfolio strategy: "one dominant, multiple strong" (一超多强). In H1 2026, 6 IPs exceeded RMB 1 billion and 11 exceeded RMB 100 million in revenue76.
Key Finding 5: IP Challenges — Litigation, Counterfeiting, Artist Risks, and IP Fatigue
5a. Ty Inc. Litigation (Active, Material)
Ty Inc. v. Pop Mart Americas Inc. (Case 1:2026cv00463, N.D. Illinois): Filed January 15, 2026 with five causes of action — trademark infringement (15 U.S.C. §1114), false designation/unfair competition (§1125(a)), trademark dilution (§1125(c)), Illinois Consumer Fraud Act, and common law trademark infringement. On June 8, 2026, Judge Sharon Johnson Coleman granted a preliminary injunction blocking Pop Mart from selling its "Pucky Beanie" branded products. Pop Mart must rebrand affected products while the underlying case proceeds64. Pop Mart's FY2025 Annual Report (latest practicable date predates the injunction) states Directors are unaware of any material pending or foreseeable litigation — while noting the company maintains a global trademark monitoring system and coexistence negotiation procedures78. Separately, Pop Mart sued offensively: Pop Mart Americas v. 7-Eleven Inc. (2:25-cv-6555, C.D. Cal., July 2025) — 17 causes of action against franchisees selling counterfeit Labubu products; a further preliminary injunction was obtained against Angel Toy Store in SDNY.
5b. Counterfeiting — Escalating Scale
The counterfeiting problem expanded approximately 9x in 2025: 12 million+ infringing products intercepted in customs (vs. 1.3 million in 2024); 100+ forged authorization letters identified (vs. 10+ in 2024); 21 overseas infringing websites taken down (vs. 5 in 2024); Pop Mart's trademark portfolio grew from 1,218 registered marks to 11,721 (end-2025, inclusive of applications)65. CBP seized 11,000+ counterfeit Labubus at Seattle airport in September 2025. The US CPSC issued an urgent safety warning in August 2025 on lookalike Labubu dolls (choking hazard, toxic materials). Product authentication: nine distinctive teeth, peach face, logo on foot, QR code, UV stamp, holographic sticker packaging.
5c. Artist Relationship Management and Key Dependency
THE MONSTERS' classification as an exclusive licensed IP means Kasing Lung retains IP ownership — structurally different from MOLLY, DIMOO, and SKULLPANDA, which Pop Mart owns outright. The IPO prospectus indicated approximately 9 years and 10 months remained on the exclusive agreement as of June 2020, implying renewal milestones around FY2023-2024 and FY2027-2029. Specific current terms, renewal economics, and geographic scope are not publicly disclosed. Pop Mart manages artist relationships through co-marketing (Kasing Lung's first European autograph session in Paris in 2024)71, the annual Insight Artist program, and an explicit no-force-disruption philosophy:
"一个IP我们是一个IP也好,一个业务也好,它是需要很慢慢的孵化的一个过程。" (An IP — or any business line — needs a slow incubation process. We will not push a new IP or new business to immediately disrupt existing major IPs.) — CEO Wang Ning, AGM May 202675
5d. IP Fatigue Signals
Three structural fatigue signals are present in the data:
KeyA failure (February 2026): Yanran Chen's KeyA IP launch drew 8,000+ critical comments on Xiaohongshu. The diagnosed problem: marketing over-emphasized the creator's biography (teenage prodigy narrative) rather than the IP character's visual and emotional identity — a structural weakness when applying the artist-discovery model to artists without pre-existing fan communities.
Aesthetic threshold concern: A UBS analyst raised the "aesthetic threshold" (审美阈值) question at the H1 2026 earnings call, asking whether consumers' rising expectations from continuous plush iterations could dampen response to new launches. Management acknowledged the dynamic.
Competitive format risk: The Citi Research broker report identifies trading card games gaining popularity among young consumers as competing for the same "surprise and collection value" wallet share as blind boxes, without requiring specific IP attachment79.
Key Finding 6: Forward IP Strategy — Pipeline, POP LAND, Sony Film, and Overseas Adaptation
6a. New IP Pipeline
CRYBABY (FY2025: RMB 2,929 million; H1 2026: RMB 1,633 million): "Cry Me An Ocean" series set an all-time sales peak. Geographic anchoring in Thailand via local artist partnerships (cited by Citi broker report as primary geographic IP adaptation example). Gas-film installations appeared in Beijing, Pattaya, and Makassar in H1 202680.
DIMOO (FY2025: RMB 2,777 million; H1 2026: RMB 1,619 million): "DIMOO World x Disney" collaboration and "The Missing Day" narrative series. Received a "Special Friend of China-Thailand Golden Jubilee" state-reception honor with a limited-edition character and animated short — IP used as diplomatic soft power. DIMOO's 10th anniversary arrives in 2027.
HIRONO: Brand stores entered UK and South Korea in H1 2026 (following Shanghai and Bangkok in FY2025)84, presenting a "HIRONO lifestyle" multi-category format spanning toys, clothing, household goods, and sculptures85.
Emerging IPs (Niota, Peach Riot): Niota performed well across Asia and Western markets (designer signing event in Germany drew unexpectedly large crowds per CEO commentary). Peach Riot is in content marketing development. Neither has publicly reported revenue figures81.
6b. POP LAND Theme Park
POP LAND (opened September 26, 2023, Chaoyang Park, Beijing) reached milestones in H1 2026: the Labubu Forest Zone opened April 30, 2026; visitor traffic +70% YoY; non-family visitors = 59% of footfall; non-local tourists = 58%. Night tour launched summer 2026, capturing 25%+ of visitors. Phase II concept design commenced August 2026; Pop Street zone renovation scheduled for 202775. CEO Wang Ning's framing:
"乐园就像一个永不落幕的电影一样,然后我们就怎么来去把这个乐园变成了更好的线下的场景的体验,更沉浸式,像童话般的感受。" (The park is like a never-ending film. How do we make it a better offline experiential scene, more immersive, like a fairy tale?) — AGM, May 202675
POP BAKERY (dessert concept originating from POP LAND) opened its first standalone store at Aranaya, China (June 2026) and first overseas location at Sentosa, Singapore (July 2026, average ticket exceeding SGD 50 within first month). Twinkle Twinkle's viral "Be a Little Star" single originated from the POP LAND content production team — demonstrating the park as an IP content engine. Capital reallocation: HKD 563 million originally designated at IPO for "acquiring IP portfolio" was formally redirected to "overseas + park IP commercialization platform"75.
6c. Sony Pictures Labubu Film
On March 19, 2026, Pop Mart and Sony Pictures Entertainment confirmed a Labubu feature film. Director: Paul King (Paddington franchise, Wonka — $635 million global box office). Co-writer: Steven Levenson (Tony Award winner, Dear Evan Hansen). Format: live-action/CGI hybrid, adapting The Monsters Trilogy picture books (2015). Kasing Lung named executive producer. As of the H1 2026 earnings call, management confirmed the project is "progressing smoothly but the timeline is relatively long" — no release date set83. An earlier 2024 plan for animated Labubu and Twinkle Twinkle short films was abandoned without results, providing a reference point for execution risk. Financial terms (Pop Mart's revenue share, milestone payments) are not publicly disclosed.
6d. Geographic IP Adaptation
Pop Mart's stated principle: "rather than simply replicating the China experience, Pop Mart has deeply factored in local characteristics in each region, with different IPs and customized products."
Western markets: SKULLPANDA ranked #2, HIRONO ranked #3 in popularity; Twinkle Twinkle has a measurable gap vs. Western consumer preferences81
Labubu at FIFA World Cup 2026: Participated in both opening and closing ceremonies as the first Chinese original IP invited to the FIFA World Cup84
CRYBABY Thailand: Local artist partnerships for market-specific product development cited as the template for geographic IP co-creation
Twinkle Twinkle Western push: Management plans marketing investments, product display adjustments, and design refinements specifically targeting Western market penetration81
Short-Term and One-Time Factors
H1 2026 Labubu overseas decline: THE MONSTERS revenue fell -7.5% YoY in H1 2026 primarily due to overseas market normalization from an exceptional viral peak in 2025. Overseas operating margin is explicitly expected to decline in FY2026. H2 2026 data will determine whether this is a base-effect normalization or a sustained deceleration.
Inventory build-up: Inventory turnover days worsened from 123 days (FY2025) to 201 days (H1 2026). Management attributes this to strategic overseas pre-positioning; states inventory began declining in July 2026.
Ty Inc. injunction disclosure timing: The June 8, 2026 injunction postdates the FY2025 Annual Report's latest practicable date. The H1 2026 Interim Report (August 20, 2026) is the earliest official filing that may acknowledge the Pucky Beanie rebranding obligation.
UFLPA investigation: April 2026 announcement of an investigation into potential Xinjiang cotton content under the Uyghur Forced Labor Prevention Act — outcome not yet disclosed; material US import risk if confirmed.
Information Sources, Limitations, and Pending Conflicts
Key sources:
# | File | file_id | Key use |
|---|---|---|---|
1 | FY2025 Annual Report | 243137 | IP revenue, royalty accounting, trademark compliance |
2 | H1 2026 Results Announcement | 247933 | H1 2026 IP-level revenues, CRYBABY/HIRONO activations |
3 | H1 2026 Earnings Call Transcript | 250125 | Management commentary, geographic IP, de-concentration framing |
4 | FY2024 Annual Report | 243141 | IP characterization, minimum guarantee risk, licensing terms |
5 | H1 2025 Interim Report | 243139 | THE MONSTERS H1 2025 data, first Twinkle Twinkle appearance |
6 | 2026 AGM Transcript | 172402 | IP incubation philosophy, POP LAND, outbound licensing pivot |
7 | IPO Prospectus | 132694 | Three-tier classification, 93 IPs, PUCKY case study, IP mix evolution |
8 | Citi Research Broker Report (Dec 2024) | 243571 | MOLLY 42% peak, contractual terms, competitive risks |
Information limitations:
Kasing Lung's current contract renewal status and specific royalty rates are not publicly disclosed
Sony Pictures film financial terms (revenue sharing, milestone payments) not disclosed
KeyA commercial revenue post-February 2026 launch not yet in company filings
UFLPA/Xinjiang cotton investigation outcome pending
FY2021 and FY2022 annual reports not in local database; MOLLY's peak-period data relies on the Citi broker report and FY2023 AR comparatives
Pending conflicts from evidence reconciliation (note for readers):
CONFLICT-9 (MOLLY peak year): Citi broker report cites 42% in FY2018; IPO prospectus cites 27.1% in FY2019. Both are likely correct for different years — this analysis cites both separately with source attribution.
CONFLICT-4 (THE MONSTERS precision): This analysis uses the official 38.1% figure from the FY2025 Annual Report, not the approximation "approximately 40%" appearing in some secondary sources.
CONFLICT-8 (Twinkle Twinkle FY2024 base): Confirmed as RMB 120.8 million in FY2024 (not zero, as some sources imply).
Distribution Network & Store Economics
Study Pop Mart's distribution network (retail stores, Roboshops, online, wholesale/overseas), store expansion strategy and pace, single-store economics (sales per store, rent, payback period), profitability by channel, and comparison with global specialty retail peers.
Analyze Pop Mart's distribution network structure, store expansion strategy, single-store economics and profitability by channel, and how these compare with global specialty retail and collectible toy competitors.
Pop Mart: Distribution Network, Store Expansion Strategy, Single-Store Economics, and Peer Comparison
Executive Summary
Pop Mart operates a four-format omni-channel distribution network — physical retail stores, roboshops (vending machines), online channels, and wholesale/other — spanning 21 countries as of H1 2026. The most structurally significant facts from available filings are: (1) per-store revenue productivity varies dramatically by geography, from ~RMB 20.7 million per year for mainland China stores to ~RMB 50.8 million for Asia-Pacific, driven partly by tourist-destination locations; (2) a revenue-linked variable lease structure means rent expense is largely a variable cost, not a fixed one; (3) Pop Mart's 72.1% FY2025 gross margin reflects a 2.6%-of-revenue IP cost structure versus Funko's estimated 10-15% royalty load — this structural difference, not operating scale alone, accounts for the majority of the gross margin gap versus peers.
Key Finding 1: The Four-Format Network and its H1 2026 Footprint (676 Stores + 2,827 Roboshops)
As of June 30, 2026, Pop Mart operated 676 physical stores and 2,827 roboshops across 21 countries86. The network is structured around four formats, each serving a distinct function in the consumer journey:
Format | Count (H1 2026) | Primary Role |
|---|---|---|
Physical retail stores | 676 | Brand experience, new customer acquisition |
Roboshops (vending machines) | 2,827 | Market entry, convenience repurchase |
Online channels | Multiple platforms | Repurchase at scale, cross-border demand capture |
Wholesale and others | n/a (revenue line) | Theme park (POP LAND), POP BAKERY, POPOP jewelry |
Management explicitly described the omni-channel consumer journey as: offline store encounter → subway roboshop → livestream → e-commerce purchase → theme park/exhibition when traveling → return to store with deeper brand affinity87. This sequential logic is the stated design principle behind the multi-format co-existence.
Regional store breakdown (H1 2026 vs. end-FY2024 baseline)8688:
Region | End-FY2024 | End-FY2025 | H1 2026 | Net change H1 2026 |
|---|---|---|---|---|
China (PRC) | 431 | 445 | 455 | +10 |
Asia-Pacific | 54 | 85 | 90 | +5 |
Americas | 22 | 64 | 86 | +22 |
Europe | 14 | 36 | 45 | +9 |
Total | 521 | 630 | 676 | +46 |
Note on FY2024 total: The "521" figure appears in secondary sources; Pop Mart's FY2024 annual report sub-totals sum to 491. The 491 figure from the official filing is the authoritative baseline.89
Geography | End-FY2023 | End-FY2024 | End-FY2025 | H1 2026 |
|---|---|---|---|---|
PRC total | 2,190 | 2,339 | 2,396 | ~2,482 (derived) |
International | ~99 | ~192 | ~241 | ~345 (derived) |
Global total | ~2,289 | ~2,531 | 2,637 | 2,827 |
Reconciliation note: Some upstream sources cited "~431 international roboshops" at H1 2026, which is arithmetically inconsistent with total 2,827. Authoritative: total = 2,827 (confirmed from H1 2026 interim report86); domestic = ~2,482; international = ~345 (residual).
Key Finding 2: Store Expansion Strategy — Two Phases, One Doctrine Shift
FY2025 was maximum expansion velocity; FY2026 is an explicit adjustment phase centered on quality over quantity.
In FY2025, Pop Mart added 109 net stores globally — Americas tripled its base from 22 to 64 (+42 net), Europe added +22, Asia-Pacific +31. China domestic decelerated to just +14 net stores88. The annual report states:
"In the PRC market, our focus shifted to upgrading stores namely transforming retail spaces into more narrative-driven, artistic, and interactive brand experience venues."91
China strategy (FY2025-2026): Active program of relocating and upsizing stores from sub-100 sqm to the standard 150-200 sqm format. In H1 2026, 20+ stores were relocated/upgraded across T1, new T1, T2, T3 cities and HK/Macao/Taiwan — both store efficiency and floor area saw double-digit growth. Flagship stores were opened not only in Tier 1 cities but also in Tier 2 and Tier 392. Dozens more upgrades are planned for H2 2026.
Overseas sequencing and DTC model: Geographic sequence: East Asia → Southeast Asia → Americas and Europe. All international stores are self-operated and 100%-owned, except Singapore, Taiwan, Japan, and Thailand (joint ventures)93. Transition from B2B wholesale to DTC for overseas was completed by end-FY202493.
New markets entered in FY2025: Germany, Denmark, Canada, Philippines; flagship stores at Bangkok, Shanghai, and Sydney landmark complexes94.
Standard store format: 150-200 sqm globally. Large-format flagships are selective, not the group-wide template95:
"持续开大店并不是整体策略,只是针对重点国家与市场的做法,绝大多数门店的主力店型依然是150-200平。" (H1 2026 earnings call)95
H1 2026 regional operational adjustments96:
Americas: inventory forecasting errors and supply chain issues under Labubu demand volatility
Europe: reviewed all open/upcoming stores; renegotiated leases or abandoned certain new openings to trade expansion speed for certainty
Asia-Pacific: team rebuild complete; focus on relocating early small-footprint stores to standard format
Concurrently, Pop Mart restructured from four separate regional structures to a unified global platform managed by a central middle office97.
Roboshop-first market entry: International roboshop count grew 9 (2021) → 49 (2022) → 99 (2023) → 162 (H1 2024) → 241 (end-FY2025) → ~345 (H1 2026)9386 — consistently deployed ahead of physical stores to test demand.
Key Finding 3: Per-Store Revenue Productivity — Wide Geographic Dispersion
Figures are derived from official segment revenue divided by year-end store counts and reflect a blend of mature and newly-opened stores. Americas FY2025 figures are biased upward due to 42 of 64 stores opening during the year.
FY2025 per-store retail revenue by geography9899100101:
Region | Year-end stores | Retail store revenue | Revenue per store (RMB M) | Revenue per store (approx. USD M) |
|---|---|---|---|---|
China mainland | 410 | RMB 8,502.7M | ~20.7 | ~2.8 |
HK/Macao/Taiwan | 35 | RMB 1,572.7M | ~44.9 | ~6.1 |
PRC total | 445 | RMB 10,075.4M | ~22.6 | ~3.1 |
Asia-Pacific | 85 | RMB 4,318.9M | ~50.8 | ~6.9 |
Americas | 64 | RMB 2,003.8M | ~31.3 | ~4.3 |
Europe | 36 | RMB 856.2M | ~23.8 | ~3.2 |
H1 2026 annualized run-rate for China: 455 stores generating RMB 6,089.7M H1 retail revenue102 → ~RMB 26.8M annualized/store, an improvement versus FY2025's ~RMB 22.6M.
Sales/sqm estimate: At the stated 150-200 sqm standard format (midpoint ~175 sqm)95, implied PRC mainland sales density is approximately RMB 118,000-138,000/sqm/year. No official sqm data is disclosed.
Roboshop unit economics (FY2025)103:
Metric | Value |
|---|---|
PRC unit count (year-end) | 2,396 |
Total PRC revenue | RMB 1,345.9M |
Revenue per unit/year | ~RMB 561,700 |
Revenue per unit/month | ~RMB 46,800 |
Ratio vs. retail store (per unit) | ~2.5% |
Depreciation useful life | 5 years104 |
Roboshops generated only 6.5% of PRC revenue despite 2,396 units versus 445 stores105 — confirming their role as brand touchpoints and convenience access points rather than primary revenue generators.
Key Finding 4: Revenue-Linked Lease Structure — A Defining Feature of Store Economics
Many Pop Mart leases include revenue-based variable rent clauses. Variable lease payments surged +255% YoY to RMB 1,128.0 million in FY2025, directly mirroring the +184.7% revenue increase106. This structure converts rent from fixed to variable, reducing downside risk in lower-revenue periods.
FY2025 lease cost breakdown (group-level)106:
Cost component | FY2025 (RMB M) | FY2024 (RMB M) | YoY |
|---|---|---|---|
ROU depreciation — retail stores | 519.4 | 373.6 | +39% |
Variable lease payments (revenue-based) | 1,128.0 | 317.4 | +255% |
Short-term lease expense | 210.3 | 140.5 | +50% |
Total lease-related cost | ~1,857.7 | ~831.5 | +123% |
Estimated rent as % of PRC store revenue: approximately 18-19% (all three components ÷ 445 stores ÷ RMB 22.6M/store). Estimated store-level labor cost: RMB 1,323.2M ÷ 445 stores ≈ RMB 3.0M/store = ~13% of revenue107. Together, rent (~19%) + labor (~13%) + product COGS (~28%) leaves an implied store-level contribution margin of approximately 40% for a mature PRC store — these are derived estimates, not officially disclosed.
Total FY2025 capex: RMB 1,171.5 million (+126.7% YoY)104. Overseas non-current assets grew from RMB 540.8M (FY2024) to RMB 2,672.8M (FY2025) — a 5x increase reflecting the international store build-out108.
Key Finding 5: Segment Profitability — PRC Improving, Overseas Compressing Sharply in H1 2026
Note: Segment result excludes unallocated corporate overhead (RMB 1,399M in FY2025) and other gains/losses — it does not equal IFRS operating profit.
Segment margin trajectory109110111:
Period | PRC Revenue (RMB M) | PRC Segment Margin | Overseas Revenue (RMB M) | Overseas Segment Margin |
|---|---|---|---|---|
FY2024 | 8,886 | 40.0% | 4,151 | 38.8% |
H1 2025 | 8,283 | 48.9% | 5,593 | 44.2% |
FY2025 | 20,852 | 50.1% | 16,268 | 49.2% |
H1 2026 | 12,201 | 53.0% | 4,972 | 30.3% |
FY2025 overseas segment margin of 49.2% — near PRC parity — reflected Labubu-driven revenue surge with largely fixed cost structures (operating leverage). The H1 2026 reversal to 30.3% was driven by: (1) Labubu cooldown causing overseas revenue to decline ~11% YoY, compressing scale benefits; (2) pre-opening rent and staffing costs for H2 2026 stores being expensed in H1112.
Group-level P&L (FY2025)113:
Item | FY2025 (RMB M) | % of revenue |
|---|---|---|
Revenue | 37,120 | 100.0% |
Cost of sales | 10,355 | 27.9% |
Gross profit | 26,765 | 72.1% |
Distribution and selling expenses | 8,082 | 21.8% |
G&A expenses | 1,770 | 4.8% |
Operating profit | 16,890 | 45.5% |
Net profit | 13,012 | 35.1% |
Multi-year margin trajectory114:
Metric | FY2021 | FY2022 | FY2023 | FY2024 | FY2025 | H1 2026 |
|---|---|---|---|---|---|---|
Revenue (RMB B) | 4.49 | 4.62 | 6.30 | 13.04 | 37.12 | 17.17 |
Gross margin | 61.4% | 57.5% | 61.3% | 66.8% | 72.1% | 69.7% |
Net margin | 19.0% | 10.3% | 17.3% | 25.4% | 35.1% | ~29.7% |
Non-IFRS adj. net margin | 22.3% | 12.4% | 18.9% | 26.1% | 35.2% | 30.0% |
H1 2026 gross margin compression of -0.6 ppt to 69.7% decomposed by CFO: overseas revenue mix decrease (-0.9 ppt), raw material/logistics cost increases (-0.7 ppt), lower licensing fees (+1.0 ppt)115.
Key Finding 6: FY2025 Channel Revenue Mix by Region
PRC channel revenue (FY2025 vs. FY2024)105:
Channel | FY2025 (RMB M) | Share | FY2024 (RMB M) | YoY |
|---|---|---|---|---|
Retail stores | 10,075 | 48.3% | 4,601 | +119.0% |
Roboshops | 1,346 | 6.5% | 751 | +79.3% |
Pop Draw (mini-program) | 3,423 | 16.4% | 1,114 | +207.4% |
Tmall flagship | 1,785 | 8.6% | 628 | +184.4% |
Douyin | 1,590 | 7.6% | 601 | +164.4% |
Online — Other | 1,724 | 8.3% | 429 | n/a |
Wholesale and others | 908 | 4.3% | 763 | +19.0% |
PRC Total | 20,852 | 100% | 8,886 | +134.6% |
Pop Draw (the proprietary WeChat mini-program blind-box platform) was the single highest-revenue online sub-channel at RMB 3,423M — surpassing both Tmall and Douyin105.
Regional channel mix comparison (FY2025)116117118:
Region | Offline share | Online share | Wholesale share | Total revenue |
|---|---|---|---|---|
PRC | 54.8% | 40.9% | 4.3% | RMB 20,852M |
Asia-Pacific | 55.1% | 38.1% | 6.8% | RMB 8,011M |
Americas | 32.8% | 64.0% | 3.2% | RMB 6,806M |
Europe | 60.1% | 34.8% | 5.1% | RMB 1,451M |
Americas' 64% online share in FY2025 was driven by Labubu viral demand in conditions of insufficient store coverage and is expected to normalize toward offline as the store network matures112. By H1 2026, Americas revenue declined 16.5% YoY and Asia-Pacific declined 9.7%, while China rose +47.3%119.
Key Finding 7: Peer Benchmarking — Gross Margin Gap Is Structural
Peer comparison table:
Company | Revenue (latest FY) | Gross margin | Operating margin | Net margin | Distribution model | IP model |
|---|---|---|---|---|---|---|
Pop Mart (FY2025) | RMB 37.1B | 72.1% | 45.5% | 35.1% | 100% DTC | Owned/exclusive; ~2.6% design fee |
Pop Mart (H1 2026) | RMB 17.2B | 69.7% | PRC 53% / Overseas 30% (segment) | ~29.7% | 100% DTC | Owned/exclusive |
MINISO Group (FY2025) | RMB 21.4B | 45.0% | ~15.4% | ~5.6%* | Franchise + direct | Licensed IP + variety retail |
TOP TOY (FY2025 GMV) | GMV RMB 2.6B | ~40% est. | n/a | n/a | Direct + franchise | Licensed collectible toys |
Funko (FY2023/24 est.) | ~USD 1.0B | ~42% | ~8-12% | ~15% | Wholesale-first | Exclusively licensed |
Hasbro (FY2024) | ~USD 4.3B | ~50% | ~8-12% | ~7% | Wholesale-first | Owned + licensed |
Mattel (FY2024) | ~USD 5.4B | ~50% | ~11-14% | ~10% | Wholesale-first | Owned + licensed |
*MINISO FY2025 net margin depressed by Yonghui equity-method losses.
Primary driver of Pop Mart's gross margin premium: Design and licensing costs at RMB 950.5M = 2.6% of revenue in FY2025. Proprietary IP artists receive design fees in the single-digit percentage range with annual caps120. Funko pays an estimated 10-15% royalty on licensed characters120. This 7-12 ppt structural difference explains the majority of the gross margin gap. Secondary driver: Pop Mart earns full retail margin on >95% of revenue (DTC); Hasbro/Mattel earn wholesale margin on 60-70% of their revenue.
TOPTOY vs. Pop Mart per-store (FY2025)121:
Metric | Pop Mart China mainland | TOP TOY China |
|---|---|---|
Store count | 410 | ~325 (avg) |
Revenue per store/year | ~RMB 20.7M | ~RMB 5.2M |
Pop Mart premium | — | ~4x higher |
MINISO same-store GMV declined high-single-digit in FY2025 in China122, contrasting with Pop Mart's triple-digit same-store productivity surge.
Funko gross margin comparability note: Funko's US GAAP COGS definition may include some distribution costs recorded by Pop Mart under "selling expenses." This accounting difference may overstate Pop Mart's gross margin advantage by an estimated 3-5 ppt on a like-for-like basis.
Short-Term Factors and Metric Caveats
Labubu surge (FY2025, one-time): Americas 64% online share and FY2025 per-store averages for rapidly expanding geographies are distorted by the Labubu viral phenomenon — not representative of steady-state channel mix or mature store economics.
H1 2026 gross margin (69.7%) vs. FY2025 (72.1%): Period-specific difference driven by overseas revenue mix shift, not a structural product-level change115.
Overseas segment margin H1 2026 (30.3%): Includes pre-opening costs for H2 store openings — these will not recur post-opening112.
FY2022 net margin low (10.3%): Reflects China COVID/lockdown disruption, not a baseline estimate.
Information Limitations and Pending Conflicts
Limitations: No channel-level gross margin by format (retail vs. roboshop vs. online) officially disclosed. No official per-store capex target or payback period. No roboshop capital cost per unit disclosed. H1 2026 full sub-channel revenue breakdown table not yet available. Funko/Hasbro/Mattel figures from secondary sources only.
Pending conflicts: (1) International roboshop count H1 2026: authoritative total = 2,827; domestic = ~2,482; international = ~345 (some EBs cited "~431" — flagged as likely error). (2) MINISO gross margin: authoritative figure is 45.0% from FY2025 annual report; "~40%" in some sources is stale. (3) Funko gross margin: ~42% from secondary sources; accounting basis caveat applies (3-5 ppt).
Moat & Competitive Landscape
IP portfolio defensibility, barriers to entry, competitive positioning vs global peers
What is Pop Mart's competitive moat? Analyze IP portfolio defensibility, barriers to entry, and competitive positioning vs global peers.
Pop Mart's Competitive Moat: IP Portfolio Defensibility, Barriers to Entry, and Global Peer Positioning
Executive Summary
Pop Mart's competitive position rests on five compounding structural layers: a proprietary and exclusively licensed IP portfolio that generates 72.1% gross margins — structurally superior to licensing-dependent peers who pay 10-17% royalties; a first-mover advantage in artist acquisition that locked in the field's top talent before the category was widely recognized; a 72.58-million-member data and loyalty flywheel; a globally unmatched retail and roboshop distribution network; and a deliberate CEO decision to operate as a closed IP ecosystem rather than a licensing-out platform. The most material analytical caveat is that THE MONSTERS/Labubu — generating 38.1% of FY2025 revenue — is classified as an "artist IP" in Pop Mart's reporting but is legally an exclusive license from artist Kasing Lung, not a fully owned property, introducing renewal risk that the headline "artist IP share" metric does not make visible.
KF1: Gross Margin Structural Advantage Traces Directly to IP Ownership — 72.1% vs. Funko's 17.4% Royalty Rate
Pop Mart's gross margin has expanded continuously: 57.5% (FY2022) → 61.3% (FY2023) → 66.8% (FY2024) → 72.1% (FY2025)125. H1 2025 alone reached 70.3%, up from 64.0% in H1 2024126. The primary driver is IP ownership structure: when Pop Mart owns or exclusively licenses an IP, the royalty cost layer that encumbers licensing-dependent peers is eliminated or minimized.
Funko's entire business runs on licensed third-party entertainment IPs, resulting in a royalty rate of 17.4% of FY2025 revenue — total royalty expense of USD 158.5 million — with accrued royalties of USD 59.8 million on the balance sheet127128. Funko's licenses are generally non-exclusive with 2-3 year terms, giving IP owners continued pricing leverage at each renewal. This structural cost disadvantage contributed to Funko reaching going-concern territory by 2025.
Pop Mart's total IP-related design and license costs were RMB 506.8 million in FY2024 on RMB 13.04 billion of revenue (~3.9% of revenue), while gross margin simultaneously improved from 61.3% to 66.8%129. Mattel's FY2025 gross margin was 48.9% on net sales of USD 5.35 billion130. Hasbro's FY2025 revenue was USD 4.7 billion (+14% YoY), with its Wizards of the Coast segment (Magic: The Gathering, Dungeons & Dragons — both fully owned IPs) generating a 46% operating margin, its highest-margin segment131. Hasbro's Consumer Products segment, relying more on licensed entertainment IP, declined 4% in FY2025131. The Hasbro CEO explicitly cited Pop Mart as a peer in the "GEM-squared" category: gamified, entertainment-driven, multipurchase, multigenerational products131.
Company | Revenue FY2025 | Gross Margin FY2025 | IP Ownership Model | Effective Royalty / IP Cost |
|---|---|---|---|---|
Pop Mart (9992.HK) | RMB 37.12B | 72.1% | Owned + exclusive licensed | ~3-5% of revenue |
Funko (FNKO) | ~USD 1.1B | 41-43% | 100% licensed-in | 17.4% of revenue |
Mattel (MAT) | USD 5.35B | 48.9% | Primarily owned iconic IPs + licensed entertainment | Lower (owned IPs dominate) |
Hasbro (HAS) | USD 4.7B | ~45% | Owned flagship IPs + licensed Consumer Products | Mixed by segment |
KF2: Three-Tier IP Ownership Structure — Portfolio Breadth Improving, but THE MONSTERS Concentration Is the Central Risk
Pop Mart's IP portfolio operates on three tiers with materially different defensibility profiles:
Tier 1 — Fully Owned Proprietary IPs (MOLLY, SKULLPANDA, DIMOO, Sweet Bean, HIRONO): Full development and commercial rights, perpetual, zero renewal risk. Pop Mart's in-house PDC studio produced HIRONO, Twinkle Twinkle, and CRYBABY — with CRYBABY achieving +1,537% YoY growth in FY2024132. HKD 86.6 million of IPO proceeds was earmarked for in-house designer recruitment133.
Tier 2 — Exclusively Licensed IPs (THE MONSTERS/Labubu from Kasing Lung): Exclusive commercial rights in specified territories. Initial 4-year term, performance-based extensions to 6+ years. THE MONSTERS generated RMB 14.161 billion in FY2025, accounting for 38.1% of total revenue — up from ~23% in FY2023134. This is the single largest IP and the single largest renewal risk in the portfolio.
Tier 3 — Non-exclusively Licensed IPs (Mickey Mouse, Hello Kitty, Despicable Me, NBA): 1-2 year terms, not automatically renewable. Pop Mart pays minimum guaranteed royalties. This tier represented approximately 9.1% of FY2025 revenue134 — a declining share.
Reconciliation flag: Pop Mart's financial reporting consolidates Tier 1 and Tier 2 as "artist IPs" (90.0% of FY2025 revenue)134. THE MONSTERS/Labubu — contributing 38.1% of total revenue — is an exclusive license from Kasing Lung, not a company-owned character. A failure to renew or a material change in terms would be a concentrated event at significant revenue scale.
Portfolio diversity below the headline is improving: 17 artist IPs each exceeded RMB 100 million in FY2025, compared to 13 in FY2024 and approximately 10 in FY2023135136. MOLLY's revenue share declined from 42% of total in 2018 to approximately 7.8% in FY2025 — illustrating both IP lifecycle risk and Pop Mart's demonstrated ability to rotate into new IPs across a decade137. Wang Ning at the 2026 AGM: "MOLLY is 20 years old, Labubu is 11 years old as characters — this is not a one-season phenomenon"137.
IP / Category | FY2023 | FY2024 | FY2025 | FY2025 Share |
|---|---|---|---|---|
THE MONSTERS (Tier 2 exclusive license) | RMB 368M | RMB 3.04B | RMB 14.16B | 38.1% |
Artist IPs total (Tier 1 + Tier 2) | 76.5% of revenue | 85.3% of revenue | 90.0% of revenue | 90.0% |
Licensed IPs (Tier 3) | ~23.5% | ~14.7% | ~9.1% | 9.1% |
IPs exceeding RMB 100M | ~10 | 13 | 17 | — |
H1 2025 THE MONSTERS revenue | — | — | RMB 4.814B | ~34.7% of H1 |
KF3: First-Mover Artist Acquisition — Signed the Top Talent Before Anyone Else Recognized the Category
CEO Wang Ning secured exclusive or proprietary agreements with leading pop-toy artists before competitors recognized the category as a large industry139140. The structural economics: each production steel mold costs RMB 1-2 million — an amount no individual artist can finance independently141. Pop Mart operates as a "record label for artists," providing industrial-scale commercialization — design, mold production, manufacturing, supply chain, DTC retail — that individual creators cannot replicate141.
The IP sourcing model operates through three channels: (1) independent external artists, (2) established entertainment IP providers (Disney, Sanrio, Warner Bros., NBA), and (3) Pop Mart's internal PDC team142. The PDC pipeline directly addresses renewal concentration risk by building proprietary IPs internally132. The virtuous circle from the IPO prospectus: a broader IP portfolio attracts more artists → stronger sales generate data for IP investment decisions → data feedback improves IP success rates143. The blind-box format reinforces this loop: 12 designs per series plus a hidden edition at 1:144 probability drives repeat purchases to complete a set, generating dense transactional data across the member base144.
KF4: Multi-Layer Non-IP Moat — 72.58M Members, 630 Stores, 2,637 Roboshops Compound the IP Advantage
Membership and Data Flywheel: China mainland registered members grew from approximately 7 million (H1 2020) to 72.58 million (end-FY2025)145. Members contribute 93.7% of all FY2025 sales145. Repeat purchase rate: 43.9% (H1 2024) → 49.4% (FY2024) → 55.7% (FY2025)145. H1 2025: 59.12 million members contributing 91.2% of sales at a 50.8% repeat rate146. HKD 346.9 million of IPO proceeds was allocated to digital systems covering membership, marketing, logistics, supply chain, and store management147. Citi Research described Pop Mart as the "only one of few pop toy plays in China with a full-fledged IP ecosystem, from IP design and operation to IP marketing and distribution"148, and noted store staff expertise in each IP character's lore as an execution-level competitive differentiator149.
Retail and Roboshop Network: End-FY2025: 630 stores globally across 20 countries (+109 net YoY), 445 in China150. Roboshops: 2,637 globally (+165 net), 2,396 in China. Citi's 2023-vintage data: Pop Mart China 363 stores + 2,190 roboshops vs. TOP TOY 148 stores and 52toys 13 stores151. China market share: 8.5% (2019) → 13.6% (2021)152. Funko operates no vending machine network and only three branded stores globally.
Per-capita IP spend headroom: China per-capita IP merchandise spend approximately RMB 51 vs. global average RMB 227; US per-capita spend approximately 60.7x China's current level153 — framing international expansion as a structural demand headroom opportunity, not merely geographic diversification.
Americas Channel Composition — FY2025: Total revenue RMB 6.81 billion (+748.4% YoY); online 64% (self-developed APP 42.2%, TikTok Shop 15.3%, other 6.5%); offline 33%; stores grew from 22 (end-2024) to 64 (end-2025)154.
KF5: iOS Closed Ecosystem Strategy — Deliberate Rejection of Outbound Licensing
CEO Wang Ning at the 2026 AGM: Pop Mart explicitly models itself on Apple's iOS ecosystem (closed, self-reinforcing, brand-protective) rather than the Disney/Sanrio licensing-out model155. The outbound licensing department was downgraded from an independent division to a function within the marketing department156. Outbound licensing revenue is estimated at approximately 0.19% of total revenue (SSOT wiki card — not confirmed by any single EB in this project).
The strategic reasoning: at this stage of international expansion, licensing out would generate marginal near-term revenue but risk diluting IP exclusivity and brand premium in markets where cultural cachet is still being established.
Peer contrast: Funko's model is entirely licensing-in (~900 active licenses, 13,000+ figure variants, no owned original characters)127; Hasbro's Consumer Products segment (licensed entertainment IP) declined 4% in FY2025 even as Wizards grew131; Mattel is moving toward the Pop Mart direction by acquiring the Mattel163 mobile games studio for USD 159 million to self-publish games built on owned IPs.
IP monetization extensions within the closed ecosystem: POP LAND theme park (Beijing, ~1/3 open in FY2025, summer 2026 full opening target)157; Labubu-Sony Pictures film in development158; Popop jewelry brand opened June 2025158; MEGA premium collector line (RMB 681 million FY2023, 13% of H1 2024 revenue)159; plush toys now 50.4% of FY2025 revenue at RMB 18.708 billion160.
Multi-Period Trend and Peer Comparison Tables
Table 1: Pop Mart Operating KPI Trend — FY2022 to FY2025
Shows the compounding trajectory of gross margin (IP ownership benefit), member count (data flywheel), repeat purchase rate (loyalty depth), and IP portfolio breadth. Source: FY2025 AR, H1 2025 interim report, FY2024 AR.
KPI | FY2022 | FY2023 | FY2024 | FY2025 | H1 2025 |
|---|---|---|---|---|---|
Revenue (RMB billion) | 4.61 | 6.30 | 13.04 | 37.12 | 13.88 |
Revenue Growth YoY | — | +36.7% | +107.0% | +184.7% | +204.4% |
Gross Margin | 57.5% | 61.3% | 66.8% | 72.1% | 70.3% |
Artist IP Revenue Share (Tier 1+2) | — | 76.5% | 85.3% | 90.0% | 88.1% |
THE MONSTERS Share of Revenue | ~2-3% | ~6% | ~23% | 38.1% | ~34.7% |
IPs Exceeding RMB 100M | — | ~10 | 13 | 17 | 13 (H1) |
China Members (million) | — | ~34.4 | 46.1 | 72.58 | 59.12 |
Member Sales Contribution | — | — | 92.7% | 93.7% | 91.2% |
Repeat Purchase Rate | — | — | 49.4% | 55.7% | 50.8% |
Global Stores | — | — | 521 | 630 | — |
Global Roboshops | — | — | 2,472 | 2,637 | — |
Table 2: Competitive Positioning Matrix — Pop Mart vs. Global Peers (FY2025)
Compares the four companies across dimensions most relevant to moat assessment. Gross margin is the most direct output of IP ownership structure.
Dimension | Pop Mart (9992.HK) | Funko (FNKO) | Mattel (MAT) | Hasbro (HAS) |
|---|---|---|---|---|
Revenue FY2025 | RMB 37.12B | ~USD 1.1B | USD 5.35B | USD 4.7B |
Gross Margin FY2025 | 72.1% | 41-43% | 48.9% | ~45% |
IP Ownership Model | Owned + exclusive licensed (90% of revenue) | 100% licensed-in (zero owned original IPs) | Primarily owned iconic IPs + licensed entertainment | Owned flagship IPs (Wizards) + licensed Consumer Products |
Effective Royalty / IP Cost | ~3-5% of revenue | 17.4% of revenue | Lower (owned IPs dominate) | Mixed by segment |
Membership / CRM | 72.58M members; 93.7% member sales | None | None | None |
Vending / Roboshop Network | 2,637 globally | 0 | 0 | 0 |
Branded Stores | 630 in 20 countries | 3 globally | Mass retail only | Mass retail + Hasbro Pulse DTC |
Geographic Mix | China 56%, APAC 22%, Americas 18%, Europe 4% | US + Europe primary | Global, US-heavy | Global, US-heavy |
IP Concentration Risk | THE MONSTERS 38.1% (exclusive license) | Diversified across 13,000+ licensed variants | Barbie + Hot Wheels est. ~50%+ | Wizards ~46% of operating profit |
Financial Condition | RMB 13.77B cash; zero bank borrowings | Going-concern concerns | Investment grade | Investment grade |
Outbound Licensing Strategy | Closed ecosystem — deliberately minimized | Not applicable | Active (Barbie, Hot Wheels) | Active (Transformers, GI Joe) |
Table 3: IP Tier Defensibility Framework
Tier | Examples | Ownership Type | Contract Length | Renewal Risk | Est. FY2025 Share |
|---|---|---|---|---|---|
Tier 1 — Fully Owned | MOLLY, SKULLPANDA, DIMOO, Sweet Bean, HIRONO | Full development and sales rights | Perpetual | None | ~50-55% (estimate) |
Tier 2 — Exclusively Licensed | THE MONSTERS (Labubu), CRYBABY | Exclusive territorial license | 4-yr initial, performance-based extension | Moderate; concentrated in THE MONSTERS (38.1% of total revenue) | ~35-40% (estimate) |
Tier 3 — Non-exclusively Licensed | Mickey Mouse, Hello Kitty, Despicable Me, NBA | Non-exclusive license | 1-2 years | High per agreement; low portfolio impact | ~9.1% |
Note: Pop Mart reports both Tier 1 and Tier 2 as "artist IPs" (90.0% FY2025). The Tier 1 vs. Tier 2 split above is estimated from THE MONSTERS' disclosed 38.1% share — it is not directly disclosed in Pop Mart's filings.
Short-Term Factors and Definitional Notes
Q4 2025 Growth Deceleration: Q4 2025 showed deceleration vs. H1 2025's +204% pace, triggering approximately a 20% share price decline post-results (March 2026). One-quarter data point; does not independently resolve IP lifecycle questions.
Stale Citi Margin Forecasts: Citi December 2024 projected FY2025E gross margin at 65.5%. Actual was 72.1% (+660 bps above estimate). Citi forecasts in that report are December 2024 vintage only.
Net Profit vs. Attributable Profit: Total "profit for the year" RMB 13.01 billion; "attributable to owners" RMB 12.776 billion. Use attributable figure for EPS, payout ratios, and ROIC calculations.
Asia-Pacific Q1 2026 Deceleration: SSOT wiki notes APAC growth decelerated from +157.6% (FY2025) to approximately +25-30% (Q1 2026). Not verified from source documents in the current EB set.
Information Limitations and Pending Reconciliation Flags
Limitations: Kasing Lung contract renewal terms and royalty rates not publicly disclosed; outbound licensing revenue (~0.19%) not confirmed by any single EB; BE@RBRICK/Medicom Toy and Sanrio financial data absent from local datasources; Tier 1 vs. Tier 2 revenue split within "artist IPs" is estimated, not disclosed.
Reconciliation Flags:
THE MONSTERS ownership: classified as "artist IP" in Pop Mart filings; legally an exclusive license from Kasing Lung. Do not equate 90% "artist IP share" with 90% "owned IP share."
Citi FY2025E margin forecast (65.5%) is stale vs. actual 72.1%. Use actual reported figures.
Net profit RMB 13.01B (total) vs. RMB 12.776B (attributable). Use attributable for per-share and payout metrics.
Management & Capital Allocation
Founder-led culture, M&A track record, overseas expansion strategy, and capital allocation discipline
Assess Pop Mart's management quality, capital allocation decisions, overseas expansion strategy, and founder-led culture.
Pop Mart (9992.HK): Management Quality, Capital Allocation, Overseas Expansion, and Founder-Led Culture
Executive Summary
Pop Mart's management quality, capital allocation, and overseas expansion are all anchored to a single individual: Wang Ning, who founded the company in 2010, led it through a 356x-oversubscribed IPO in December 2020, and built it from a multi-brand toy distributor into a proprietary IP company generating RMB 37.12 billion in revenue by FY2025161162. The most structurally important facts in this research are: (1) a deliberate pivot away from third-party IP toward full ownership in 2015-2016 created the current competitive architecture163; (2) capital allocation is being reshaped in real time — CAPEX more than doubled in FY2025 while the payout ratio fell to approximately 25% versus an analyst expectation of 36%164165; (3) overseas revenue, virtually zero before 2022, reached 43.8% of group total in FY2025, with unit economics indicating overseas sales carry higher gross margins than domestic166167; and (4) key-person concentration is real and not formally disclosed as a principal risk in the FY2025 Annual Report168.
Key Finding 1: Management Track Record — From Pre-IPO Skeptic to Post-IPO Execution
Wang Ning (born approximately 1987) founded Pop Mart in October 2010 shortly after graduating from university. Pre-IPO, investors described him as having "average education, never held a proper job, expressionless and no charisma, no elite team." Post-IPO, the same investors reversed: "calm personality, quiet, doesn't show emotions, possesses many qualities of consumer industry entrepreneurs."169
以前投资人对泡泡玛特的评价是——创始人学历平平,没正经上过班,说起话来表情平静、没感染力,团队里也没精英;上市后,每一位投资人都提到——王宁性格沉稳,话不多,喜怒不形于色,拥有消费行业创业者的许多优良品格。
The five-year margin track record is materially visible166:
Metric | FY2021 | FY2022 | FY2023 | FY2024 | FY2025 |
|---|---|---|---|---|---|
Revenue (RMB bn) | 4.49 | 4.62 | 6.30 | 13.04 | 37.12 |
Gross margin | 61.4% | 57.5% | 61.3% | 66.8% | 72.1% |
Net profit margin | 19.0% | 10.3% | 17.3% | 25.4% | 35.1% |
Non-IFRS adj. net margin | 22.3% | 12.4% | 18.9% | 26.1% | 35.2% |
The FY2022 margin trough (net margin 10.3%) coincided with China COVID lockdowns and distributor dependency on Sonny Angel — the precise risk the proprietary IP pivot was designed to eliminate. The recovery trajectory across all margin lines since FY2023 is a measurable outcome of that strategy.
Citi Research initiated coverage at Buy in December 2024, explicitly applying a 20% P/E premium above the 3-year historical average on the basis of "improving growth profile and execution."170 The same report documented core management tenure: Wang Ning (CEO/Chairman since 2010), Si De (COO since March 2015), Moon Duk Il/Justin Moon (President of International Business since August 2018), Yang Jingbing (CFO since August 2017)171. C-suite stability of 7-11 years is an observable fact.
Wang Ning's management framework has three stated pillars, articulated in internal management reviews: (1) "tracking big things" — keeping teams focused on core objectives; (2) data-driven decision-making, requiring metrics on cost and benefit of every action; (3) efficiency improvement at every level172. At one documented management review, he dissolved an underperforming member-retention team on the spot — a hands-on top-down intervention consistent with these principles despite his stated policy of operational delegation173.
Key Finding 2: Founder-Led Culture — Centralized Strategy, Delegated Operations, Personal-Network Team
The management team's organizational origin is documented: COO Si De, CFO Yang Jingbing, International President Moon Duk Il, and theme park head Hu Jian are all MBA classmates of Wang Ning from Peking University Guanghua. VPs Liu Ran and Yang Tao attended the same undergraduate university as Wang Ning.174175
刘冉跟王宁毕业于同一所大学,首席运营官司德、首席财务官杨镇冰、国际业务总裁文德一和城市乐园负责人胡健是王宁在北大光华读研究生时认识的同学。
Wang Ning frames the enduring competitive advantage as the team itself, not any particular product: "What is valuable is not any particular business — it is a group of people and their shared commitment to an ideal."176
Decision-Making Architecture: At the strategic level, Wang Ning personally fields all material decisions. At the 2026 AGM, he directly addressed capital allocation (buybacks vs. dividends), flagship store location selection (Times Square, Fifth Avenue, Paris Louvre, London Oxford Street), and IP licensing philosophy177. At the operational level, membership growth, user acquisition, and retention decisions are fully delegated to COO Si De; Wang Ning acknowledges learning membership numbers only at the time of earnings releases178.
VP Liu Ran characterizes Pop Mart as a "fast-decision, slow-execution" company: strategic decisions (theme parks, gaming, film) are taken quickly, but creative teams receive long runways without short-term progress pressure — film and gaming teams can pass 1-2 director-level weekly meetings without reporting, and Wang Ning does not push them179. He explicitly frames this as reflecting his philosophy of "respecting time."
IP Ownership as Cultural Mandate: The 2015 pivot was precipitated by the Sonny Angel distributor dependency crisis — Pop Mart was repeatedly denied the right to expand or customize the product despite Sonny Angel being their largest-selling SKU. Wang Ning compared this to the Nike/Onitsuka Tiger breakup in Shoe Dog163. The subsequent decision to build proprietary IP — starting with MOLLY in 2016 — was a founder-level response to a demonstrated dependency risk.
By 2026, this philosophy has materialized into organizational policy: the licensing department has been formally downgraded in management hierarchy and placed under marketing, treating licensing as a brand tool rather than a profit center. Wang Ning framed this at the 2026 AGM as an "iOS closed ecosystem" model versus a Disney-style open licensing ("Android") approach180181:
我们更想做的是类似于IOS,就是苹果的自循环的一个东西... 如果我们自己有完善的供产品开发、产品设计,以及我们完善自己的渠道和我们自己的用户体系。其实我们在想,我们没必要或者说站在保护IP的角度上,没必要去做太多的这种授权。
The IP creative pipeline is multi-sourced: individual artist contracts (exclusive or semi-exclusive), in-house Pop Design Center (PDC) origination, established licensed brands (Disney, FIFA, Harry Potter), and local artist signing in overseas markets (Thailand cited as a successful example)182. MOLLY has been active approximately 20 years; LABUBU approximately 11 years — consistent with the stated philosophy of patient IP incubation.
Key-Person Risk: Wang Ning holds the dual roles of Chairman and CEO, a deliberate deviation from HK Corporate Governance Code Provision C.2.1. He chairs the Nomination Committee — the body responsible for succession planning — creating a structural circularity in oversight. No specific succession plan for the CEO/Chairman role has been publicly disclosed. Crucially, founder key-person dependency is absent from the FY2025 Annual Report's five principal disclosed risks168. Beneficial ownership is approximately 48.73% of shares via trust structures, giving effective veto power over ordinary resolutions.
Key Finding 3: Capital Allocation — Reinvestment Acceleration Alongside Growing but Lower-Than-Expected Shareholder Returns
Cash Flow and CAPEX
FY2025 operating cash flow reached RMB 10.865 billion (+119% YoY from RMB 4.954 billion in 2024)183. Total CAPEX was RMB 1.171 billion (+127% YoY from RMB 517 million), comprising RMB 985 million in PP&E and RMB 186 million in intangibles164. This was approximately 3x the Citi December 2024 CAPEX estimate of RMB 379 million184 — the company accelerated store network and theme park investment beyond what broker models anticipated. Implied FCF was approximately RMB 9.69 billion.
Cash Flow Metric (RMB bn) | FY2023 | FY2024 | FY2025 |
|---|---|---|---|
Operating cash flow | ~1.99 | 4.95 | 10.87 |
CAPEX | 0.32 | 0.52 | 1.17 |
Implied FCF | ~1.67 | ~4.43 | ~9.69 |
Dividends paid (prior year declared) | 0.12 | 0.37 | 1.08 |
Share buybacks executed | 0.33 | 0.08 | 0 |
Dividends and Payout Ratio: Declared dividends compounded at an extreme pace: FY2023 RMB 117 million → FY2024 RMB 1.094 billion → FY2025 RMB 3.194 billion (RMB 2.3817/share)185186. As a proportion of attributable net profit (IFRS basis, RMB 12.776 billion for FY2025), the payout ratio is approximately 25%187188 — below Citi's 35-36% forecast and flagged as a negative by analysts. No direct management commentary on the reason for the reduction below projected ratio was found in local files.
Timing note: Dividends are paid one year in arrears. The RMB 1.083 billion shown as "dividends paid" in the FY2025 cash flow statement is the FY2024 final dividend. The RMB 3.194 billion declared for FY2025 will appear as cash paid in the FY2026 cash flow statement.
Share Buybacks: No buybacks were executed in FY2025 (confirmed nil in the FY2025 cash flow statement)183. In March 2026, 3.94 million shares were repurchased at HKD 152.21/share189. A 10% share repurchase mandate (up to 134.29 million shares) was approved at the May 2025 AGM. At the 2026 AGM, Wang Ning stated buybacks and dividends are used "when we genuinely believe the stock is worth buying" and explicitly not to support the share price177.
M&A: No material third-party acquisitions in FY2025. Controlled minority buyouts: Pop Mart Japan (remaining 40%, JPY 960 million / ~RMB 45.89 million, March 2025) and Pop Mart South Asia (Singapore, wholly owned via business combination)190. IPO proceeds deployment: HK$773.6 million remaining for overseas/channel expansion (deadline December 2026); HK$386.9 million for strategic investments/IP commercialization platforms191.
ROIC: Citi Research (December 2024, post-tax EBIT margin x capital turnover methodology) estimated ROIC at 13.2% (FY2023) → 27.8% (FY2024E) → 30.9% (FY2025E) → 30.7% (FY2026E)192. Using FY2025 actuals: operating profit RMB 16.89 billion on total assets of RMB 32.10 billion implies gross asset return of approximately 52.6% — though Citi's methodology uses invested capital rather than total assets. Balance sheet growth (total assets RMB 14.87 billion → RMB 32.10 billion) was predominantly cash accumulation (RMB 6.11 billion → RMB 13.78 billion), not fixed asset investment193194.
Working Capital KPIs
Working Capital Metric | FY2023 | FY2024 | FY2025 |
|---|---|---|---|
Trade receivable days | 15 | 11 | 7 |
Inventory days | 133 | 102 | 123 |
Trade payable days | 53 | 61 | 51 |
Cash and equivalents (RMB bn) | 2.08 | 6.11 | 13.78 |
Net current assets (RMB bn) | 5.95 | 8.87 | 17.75 |
Bank borrowings | 0 | 0 | 0 |
Gearing ratio (total liabilities / total assets) | — | 26.8% | 29.4% |
Inventory day deterioration in FY2025 (102 to 123 days) is management-attributed to overseas expansion build-up and longer international lead times, compounded by 109 net new store openings195. Zero bank borrowings across all three years. Gearing increase reflects lease liability growth from store network expansion (right-of-use assets: RMB 928 million → RMB 2.791 billion)196.
Key Finding 4: Overseas Expansion — From Zero to 43.8% of Revenue in Three Years, with Regional Strategy Differentiation
Scale: Overseas revenue grew to RMB 16.27 billion (+291.9% YoY) in FY2025, representing 43.8% of group total. The group operated 185 overseas stores across 19 countries as of end-FY2025, adding 95 net stores during the year166197.
Overseas Region | FY2025 Revenue Growth | Channel Mix (H1 2025 approx.) | Strategic Framing (mgmt) |
|---|---|---|---|
Americas | +748.4% | 64% online / 33% offline | "Expansion period" — rapid US coverage |
Europe | +729.2% (H1 2025) | 60% offline / 35% online | "Brand building" — landmark sites |
Asia Pacific | +257.8% (H1 2025) | 55% offline / 38% online | Organic/viral SEA-first entry |
Note: Asia Pacific Q1 2026 growth slowed materially to +25-30% from +257.8% in FY2025 H1, representing the first visible post-peak normalization signal.
Market Selection: Southeast Asia was the first-mover region — cultural proximity, pre-existing Labubu viral following (Thai celebrity endorsement), and existing tourist retail infrastructure reduced entry risk. New markets in FY2025: Germany, Denmark, Canada, Philippines197. Qatar targeted for Middle East entry per 2026 AGM.
Channel Strategy: Full DTC transformation complete. Internationally 100% self-operated except JV markets (Singapore, Japan, Thailand). Online platform selection is market-specific: Shopee/Lazada (Southeast Asia), Amazon (Europe/Americas), TikTok live-streaming (global). In FY2024, TikTok overseas revenue grew +5,779.8% to RMB 261.9 million; Pop Mart website grew +1,246.2% to RMB 531.5 million198. The Americas 64% online revenue mix indicates physical stores function as brand discovery anchors rather than primary revenue vehicles in Western markets.
Flagship Store Prioritization as Capital Signal: Wang Ning named 2026 capex priorities at the AGM: New York Fifth Avenue and Times Square (2 locations), London Oxford Street flagship, Paris near the Louvre177200:
美国我们纽约今年会开三个非常重要的店,其中两个我们会在第五大道,然后和时代广场都是最好的位置。
Supply Chain: Real-time global backend management system monitors inventory, sales, and profits by country. Vietnam joint factory operational as of December 2024, targeting 10% of product volume for cost reduction199. New factories in Mexico, Cambodia, and Indonesia reported by Reuters (January 2026).
Scalability Risk — Logistics Costs: FY2025 transportation and logistics expenses grew +280.3% to RMB 1.78 billion (from RMB 467.6 million)201. H1 2025 growth was sharper at +546.7% to RMB 677.1 million, growing ahead of overall revenue pace in the period202. Sales headcount grew from 4,232 to 6,219 in H1 2025 alone202. Logistics cost trajectory is the primary identified operating leverage headwind for the overseas segment.
Overseas Gross Margin: Group gross margin expanded from 61.3% (FY2023) to 72.1% (FY2025)166. Management attributes this primarily to rising overseas revenue mix — overseas sales carry higher average selling prices relative to China, and the direct-to-consumer channel eliminates distributor margin sharing. Overseas segment operating margin reached approximately 49.2% in FY2025 (RMB 8.0 billion operating profit on RMB 16.27 billion revenue), approaching parity with the PRC segment's approximately 50.1%.
Short-Term / One-Time Factors and Calibration Notes
Payout ratio distinction: The FY2025 declared payout ratio (~25%) and Citi's 36% forecast are both accurate but refer to different things. SSOT wiki confirms 25% as the realized figure. The FY2025 cash flow "dividends paid" of RMB 1.083 billion is the prior year's (FY2024) declared dividend — these must not be conflated185186.
CAPEX vs. Citi estimate: Actual FY2025 CAPEX of RMB 1.17 billion was approximately 3x Citi's December 2024 estimate of RMB 379 million. Citi's FCF estimates for FY2025E are accordingly stale on this basis184203.
Inventory days FY2025 deterioration: Increase from 102 to 123 days attributed to overseas expansion build-up and longer international shipping lead times, compounded by 109 net new store openings. This is expansion-driven; structural steady-state level remains to be established195.
Yang Tao title (temporal clarification): References to "executive directors Yang Tao and Liu Ran" in founder book EBs reflect historical structure. Yang Tao resigned as executive director in March 2024 and is now VP for IP operations and R&D204205.
Moon Duk Il's title: Formal title per HK filing is "Executive Director, Vice President and President of International Business." The label "CGO" in one upstream EB is non-official shorthand204.
Information Sources, Limitations, and Pending Confirmations
Information Limitations:
No direct management commentary found on the reason for FY2025 payout ratio decline from approximately 35% to approximately 25%
CEO/Chairman succession plan: not publicly disclosed; Nomination Committee mandate exists but no plan or named candidate
Wang Ning insider selling history (2020-2026): not confirmed from local filings; requires HKEX Disclosure of Interests search
Pre-FY2023 annual reports not in local database, limiting historical capital efficiency trend analysis
Board meeting frequency, director attendance records, and committee meeting minutes not extracted
No disclosed per-store or per-ROBOSHOP P&L
Pending Confirmations (from Reconciliation):
Moon Duk Il formal title should be used (not "CGO")
Yang Tao ED references in founder book EBs are historical (pre-March 2024)
FY2025 payout ratio: confirmed ~25% (SSOT); Citi 36% was a forward estimate only
Crisis Management & Negative Events
Study the major negative events, crises, and controversies in Pop Mart's history — including the Sonny Angel dependency, COVID impact, blind box regulatory scrutiny, counterfeiting, Labubu concentration risk, overseas expansion stumbles, and H1 2026 deceleration — and assess how management identified, responded to, and resolved each risk event.
What are the major negative events, crises, and controversies in Pop Mart's history? How did management identify, respond to, and resolve each risk event? What does the track record of crisis management reveal about organizational resilience and leadership quality?
Pop Mart (9992.HK): Major Negative Events, Crisis Management, and Organizational Resilience
Executive Summary
Pop Mart has faced nine distinct categories of negative events since its December 2020 HK IPO, spanning regulatory pressure, operational safety, social media backlash, intellectual property disputes, macro/trade shocks, and financial expectation mismatch. The most structurally significant recurring vulnerability is IP concentration risk — the same dynamic that caused MOLLY to fall from 42% of revenue (2018) to 16% (2023) has re-emerged under Labubu (THE MONSTERS), which peaked at 38.1% of FY2025 revenue before declining to approximately 26% by H1 2026213. Management responses have been most decisive on operational safety and supply chain; they have been more reactive on investor communications and internal forecasting controls.
Key Findings
1. IP Concentration Risk: A Structural Recurrence, Not a Novel Event
The Labubu concentration crisis of 2025–2026 is not the company's first encounter with single-IP dependence. MOLLY's revenue share fell from 42% in 2018 to 16% in 2023, demonstrating that Pop Mart has navigated IP concentration before, albeit over a multi-year horizon213. In FY2025, THE MONSTERS franchise (Labubu-led) reached 38.1% of total group revenue — a higher peak than MOLLY — before declining to approximately 26% by H1 2026213. The recurrence under a new IP, at higher concentration, is the central structural theme across Pop Mart's crisis history.
The March 25–26, 2026 stock crash crystallized investor anxiety on this point. FY2025 results were: revenue RMB 37.1 billion (+185%), net income RMB 12.8 billion (+309% GAAP). Despite these figures, shares fell over 22% in a single session — the largest single-day drop in nearly a year210. The triggers: (a) revenue slightly missed the ~RMB 38 billion analyst consensus; (b) Q4 2025 visible deceleration; (c) dividend payout ratio cut from 35% to 25%; (d) Labubu's 38% share was perceived as dangerous concentration210. CEO Wang Ning responded on the earnings call: "Pop Mart has more than just Labubu," and compared the situation to "a rookie racing driver suddenly thrown onto an F1 circuit."210 The two-day cumulative decline exceeded 30% per SSOT wiki (bear case card), versus the -22% single-session figure widely reported — both are factually accurate for their respective reporting windows.
Subsequent IP diversification evidence by H1 2026: Twinkle Twinkle (星星人 / Star Rocks) reached RMB 2.65 billion in H1 2026 (+580.6%), and 11 IPs exceeded RMB 100 million in H1 2026214, suggesting nascent diversification progress, though Labubu remains the dominant revenue driver.
2. Blind Box Regulatory Pressure: A Recurring Threat Across Two Waves
Wave 1 (Q1 2022 — investor-driven, no enforcement): Pop Mart's first major post-IPO stock crisis was sentiment-driven. Shares fell 32.2% from a January 2022 peak of HK$47 on investor fears of a government crackdown on blind box mechanics211. No enforcement action materialized. Management's response is not documented in available filings from that period.
Regulatory formalization (June 2023): China's SAMR issued binding "Guidelines for Blind Box Business Operation (trial)": banning sales to children under 8; requiring guardian consent for ages 8–17; mandating public odds disclosure; encouraging purchase volume limits. These applied industry-wide. Pop Mart's documented response included compliance, formulation of a Minor Privacy Agreement, and maintenance of the 100% complaint clearance rate212. Management narratives consistently emphasized that over 80% of Pop Mart buyers are adults.
Wave 2 (June 20, 2025 — state media escalation): People's Daily published an editorial calling blind boxes "business traps" exploiting psychological triggers and criticizing rare-edition probability disclosure (stated at under 2%)206. Morgan Stanley removed Pop Mart from its China/HK focus list the same week206. Shares fell 12.1% for the week ending June 20, wiping HK$30.89 billion (~US$3.93 billion) in market value206. Context: shares had risen approximately 500% in the preceding 12 months. Management's response was to restate the adult buyer composition argument and accelerate the overseas diversification narrative. No product changes were announced.
3. In-Store Safety Crisis (May–June 2025): Multi-Market Operational Failure from Scalper Economics
The most acute operational safety crisis unfolded across three markets simultaneously in May–June 2025. Viral videos of customer fights led Pop Mart to suspend in-store Labubu sales at all 16 UK stores207. South Korea followed on June 14 with a nationwide suspension207. San Francisco stores ceased Labubu sales after pepper-spray incidents, theft, and a reported US$30,000 heist in California207209.
Management's response was notably proactive on the safety dimension. The UK statement cited pulling products specifically to "prevent any potential safety issues" before any employee was confirmed injured207 — a pre-emptive framing rather than a reactive damage-control posture. Management announced development of "a fairer system" for product distribution, though specifics were not detailed in official filings.
The deeper structural response came in September 2025: Pop Mart reportedly ramped Labubu plush production to approximately 30 million units per month (a 10x increase from prior-year levels per CNBC — this figure is single-source and unverified in official filings)209, and publicly welcomed falling resale prices, stating: "if purchases are solely for making a profit, this model will eventually crash."209 This represents a deliberate decision to deflate scalper economics at the cost of short-term scarcity premium. UK stores reopened approximately 3 months after the suspension.
4. H1 2026 Overseas Revenue Collapse: First-Ever Overseas Decline
The August 20, 2026 H1 2026 results produced Pop Mart's first-ever overseas revenue decline214. Total overseas revenue fell 11.1%; Americas -16.5%; APAC ex-China -9.7%; Europe +5.9%. Online overseas channels fell more sharply: Americas -45.6%, APAC -39.8%, Europe -59.0%214. Inventory turnover days ballooned from 83 days (H1 2025) to 201 days214217. CEO Wang Ning publicly admitted: "We will most likely fail to hit the 20% growth target."214
COO Si De's earnings call identified root cause: inaccurate sales forecasting from the 2025 hyper-growth period, leading to an inventory build-up that could not be absorbed once Labubu demand normalized217. Wang Ning's retrospective signal recognition was unusually candid:
"From purely numerical perspective, last year sales were growing very rapidly, but I actually believe last year was the year that exposed the most problems — behind the numbers, what we saw was customers at stores either panic-buying or queuing for long periods, and this should not be the norm. From supply chain, to store operations, to personnel management, many regions had various problems."218
Management's announced remediation package for the 2026 "adjustment year"214:
RMB 2–5 billion share buyback over 6 months
No interim dividend
Organizational restructuring: four regional HQs consolidated into unified zhongtai (中台) shared services model
Regional rebuilds: Americas merchandise forecasting overhaul; Europe lease renegotiations; APAC full talent rebuild
Supply chain: new production lines as "core priority for next 1–2 years"; overseas local factory supply development; regional warehousing across 10+ countries217219
The Americas data highlights a demand problem, not a distribution one: Americas revenue fell 16.5% even as store count nearly doubled from 41 to 86214.
5. IP Legal Landscape: Substantial Offence, One Documented Setback
Pop Mart has built substantial IP enforcement capability: 11,721 trademarks, 1,995 copyrights, 67 patents; 430 infringement lawsuits in FY2025; 12 million+ infringing products intercepted at customs; 21 overseas infringing websites taken down212. Two high-profile offensive cases:
Bambu Lab (MakerWorld) copyright suit (filed March 2026): Pop Mart sued the 3D-printer platform for hosting Labubu templates with approximately 20,000 downloads (~3 yuan to print vs. scalper prices of hundreds of yuan). Trial was scheduled April 2, 2026 at Shanghai Pudong People's Court. MakerWorld removed infringing models after suit filing215. Outcome: unresolved as of research date.
7-Eleven California franchises (filed approximately mid-2025): Pop Mart sued eight franchises for selling counterfeit "Lafufu" toys mimicking Labubu215.
The one documented defensive setback: Ty Inc. (Beanie Babies) vs. Pop Mart. Ty sent a cease-and-desist in October 2025 over Pucky series products bearing "Beanie"-related trademarks. In June 2026, an Illinois federal court granted Ty's preliminary injunction blocking Pop Mart from selling affected Pucky products in the US216. Pucky is a licensed third-party IP. This is the only documented instance of Pop Mart losing an IP dispute in a major overseas market. No management response statement found in available filings.
6. November 2025 Livestream Controversy: Minor Event, Revealing Signal
In November 2025, a Pop Mart employee's on-air comment questioning whether a 79-yuan blind-box phone chain represented good value went viral on Xiaohongshu and Weibo208. Shares fell 5.5%–6% in a single day to their lowest level since May 2025208. Official response: a spokesperson stated the incident was "under investigation" — no structural policy changes documented208. Context: Labubu secondary-market prices had already declined 16% in the preceding month, making the market hypersensitive to pricing perception signals. The event reveals brand perception fragility and absence of documented employee communication protocols around a premium-priced product.
7. US-China Tariff Shock and Organizational Response (April 2025)
US tariff escalation created structural margin pressure on US operations. Initial response: a 27% price increase on Labubu 3.0 in the US (from US$22 to US$28)220 and production diversification toward Vietnam. Wang Ning simultaneously announced a four-regional headquarters structure with a new co-COO (Justin Moon) explicitly citing geopolitical and tariff risks as organizational drivers220. By the H1 2026 earnings call, the response had expanded to a full supply chain overhaul: country-by-country pricing reviews, overseas factory development, logistics optimization (sea/air mix), and 10+ country regional warehousing219.
Crisis Event Comparison Table
All nine events mapped against materiality dimensions. Share price data from CNBC, Reuters, AP, SCMP; financial data from official filings.
Event | Period | Type | Share Price Impact | Revenue Impact | Regulatory Severity | Resolution Status |
|---|---|---|---|---|---|---|
2022 Regulatory Fear Wave | Q1 2022 | Regulatory sentiment | -32.2% from HK$47 peak | None | None (no enforcement) | Resolved — 2023 SAMR guidelines followed |
2023 SAMR Guidelines | June 2023 | Regulatory compliance | Modest | Minimal | Medium (binding, industry-wide) | Resolved — compliant |
June 2025 People's Daily Editorial | June 20, 2025 | State media / reputational | -12.1% weekly | Indirect | High (state organ) | Partially resolved — no ban materialized |
May–June 2025 Store Brawls | May–June 2025 | Operational safety | Limited direct | Short-term suspension | Medium (safety liability) | Resolved — stores reopened ~3 months later |
Nov 2025 Livestream Controversy | Nov 7, 2025 | Social media | -5.5% to -6% single day | Negligible | None | Resolved — minor episode |
Oct 2025 / June 2026 Ty Inc. Injunction | Oct 2025–June 2026 | IP legal (defendant) | Limited | Pucky US withdrawal | Medium (US federal court) | Ongoing — case pending |
Mar 25–26, 2026 Earnings Crash | Mar 25–26, 2026 | Investor expectation mismatch | -22% single day; >30% two-day | None (results met prior year) | None | Partially resolved — buyback announced |
Apr 2025 US Tariff | Apr 2025 | Macro / supply chain | Limited direct | Uncertain margin impact | None | Ongoing — partially mitigated |
Aug 2026 Overseas Revenue Collapse | Aug 20, 2026 | Financial / strategic | -8.9% on results day | -11.1% overseas H1 2026 | None | Ongoing — year of adjustment |
IP Concentration Track Record: MOLLY vs. Labubu
This table compares the two instances of single-IP concentration risk, using MOLLY (2018–2023) as the historical baseline for the ongoing Labubu cycle.213
Metric | MOLLY Cycle | Labubu / THE MONSTERS Cycle |
|---|---|---|
Peak revenue share | 42% (2018) | 38.1% (FY2025) |
Most recent share | 16% (2023) | ~26% (H1 2026) |
Time from peak to documented decline | ~5 years (2018–2023) | ~1 year (FY2025–H1 2026) |
Key successor IP emerging | THE MONSTERS (Labubu) | Twinkle Twinkle (星星人) +580.6% H1 2026 |
Management structural response | IP portfolio diversification | Diversification + production ramp + org restructuring |
Associated stock crisis | HK$107.6 → HK$9.8 (era decline) | >30% two-day crash post-FY2025 results |
Short-term / One-time Factors and Reporting Basis Notes
The following items are listed to help readers separate one-time noise from structural signals:
Net income growth (definitional flag): Two figures appear across sources — "+293%" and "+309%" for FY2025 net income growth. The reconciliation task identified this as a GAAP vs. non-IFRS definitional difference, not a factual error. The "+309%" figure (AP/Reuters) uses attributable net profit; "+293%" uses a slightly different GAAP base. SSOT wiki anchors adjusted net margin to 35.2% for FY2025, implying adjusted net of approximately RMB 13 billion.
Labubu production ramp (30 million/month): CNBC September 2025 reporting only — unverified by any official Pop Mart filing. The directional claim (deliberate supply ramp to deflate scalper economics) is consistent with management public statements209, but the specific quantity should be treated as single-source and unconfirmed.
March 2026 stock decline: Both "-22% single day" and ">30% two-day cumulative" are factually accurate for their respective measurement windows — not conflicting.
Overseas revenue unit consistency: H1 2026 overseas total ~RMB 4.97 billion = 49.7 亿元. Regional SSOT sub-totals (Americas 18.9 亿元 + APAC 25.8 亿元 + Europe 5.1 亿元 = 49.8 亿元) are internally consistent.
Information Sources, Limitations, and Pending Conflicts
Information limitations:
FY2021 and FY2022 annual reports absent from local database; earliest regulatory crisis (Q1 2022) lacks contemporary management response documentation
No earnings call transcripts before H1 2026 available
Bambu Lab lawsuit outcome (trial April 2026) and Ty Inc. vs. Pop Mart case: both unresolved
Livestream controversy (Nov 2025): no governance protocol changes documented post-incident
Pre-IPO controversies not covered by available filings
Labubu production ramp quantity (30M/month): single-source, unverified
Pending conflicts (from SSOT reconciliation):
FY2025 net income growth: "+293%" vs. "+309%" — definitional mismatch (GAAP vs. non-IFRS), not a factual error
March 2026 stock decline: "-22% single day" vs. ">30% two-day" — both correct for different measurement windows
Financial Quality & Cash Flow
Revenue quality, margin trajectory, FCF generation, and working capital dynamics
Analyze Pop Mart's financial quality including revenue quality, margin trajectory, free cash flow generation, and working capital dynamics.
Pop Mart International Group (9992.HK): Financial Quality Analysis (FY2022–H1 2026)
Executive Summary
Pop Mart's financial quality from FY2022 through H1 2026 reflects three distinct phases: a COVID-trough recovery (FY2022–FY2023), a LABUBU-driven hypergrowth phase (FY2024–FY2025) that produced exceptional margins and FCF, and an H1 2026 adjustment period characterized by revenue deceleration (+23.8%), inventory overhang (201 days), FX losses (RMB 720 million), and FCF compression — all against an extreme prior-year base. The gross margin structure (69.7% in H1 2026) and positive FCF (RMB 2.91 billion in H1 2026) are the two most structurally durable financial features. The H1 2026 inventory build (RMB 6.1 billion, up from RMB 2.3 billion twelve months prior) is the most material near-term financial risk, with management citing July 2026 as the inflection point for normalization.223224225
Key Finding 1: Revenue Quality — Structural Pillars Intact, Overseas Mix Reversal Is the Central Event
H1 2026 revenue reached RMB 17.17 billion (+23.8% YoY), with China revenue growing +47.3% and overseas revenue declining -11.1% — the first-ever overseas decline.223 Overseas share fell from 40.3% of total revenue in H1 2025 to 29.0% in H1 2026.
Durable revenue quality indicators: Zero single-customer concentration confirmed across all review periods. 99.3% self-branded product revenue (proprietary IP). China online growth led by Pop Mart's own Blind Box Machine platform (+83.3% in H1 2026). Physical overseas retail stores still growing (+20.8% store revenue H1 2026) even while total overseas declined.223224 THE MONSTERS (LABUBU) IP concentration fell from 34.7% (H1 2025) to 26.0% (H1 2026); new IP Xingxing Ren emerged from 2.8% to 15.4% (RMB 2.65B); 11 IPs exceeded RMB 100M in H1 2026, demonstrating platform IP-creation capability.223224
Structural normalization of overseas online: The Americas online channel declined from RMB 4.35B full-year FY2025 (TikTok contributing RMB 1.04B) to RMB 722M in H1 2026 alone (-45.6% YoY).225226 This Americas online surge was driven by TikTok live commerce and viral LABUBU demand overflow — confirmed by management as structurally temporary. The H1 2026 data distinguish durable (physical retail stores) from ephemeral (TikTok/viral online) channels.
Base effect context: Q1 2025 overall growth was +165-170% (Americas +895-900%)227; Q3 2025 overall was +245-250%. Full-year 20% revenue growth target was explicitly flagged as potentially unachievable by management, citing geopolitical headwinds and extreme H2 2025 comparables.228
Period | Overall YoY | China | Overseas | Overseas % Mix |
|---|---|---|---|---|
FY2023 | +36.5% | ~83% share | +134.9% | ~17% |
FY2024 | +106.9% | +69.8% | +375.3% | ~39% |
FY2025 | +184.7% | +134.7% | +291.9% | ~44% |
Q1 2026 | +75-80% | +100-105% | positive | — |
H1 2026 | +23.8% | +47.3% | -11.1% |
Key Finding 2: Gross Margin — 1,460bp Structural Expansion (FY2022–FY2025), H1 2026 60bp Mix-Driven Reversal
Period | Gross Margin | YoY Change | Primary Bridge Driver |
|---|---|---|---|
FY2021 | 61.4% | — | Baseline |
FY2022 | 57.5% | -390bp | COVID lockdown COGS pressure |
FY2023 | 61.3% | +380bp | Proprietary product mix; centralized procurement |
H1 2024 | 64.0% | +360bp vs H1 2023 | Overseas mix increase; supplier bargaining230 |
FY2024 | 66.8% | +550bp | Overseas 39% of revenue; external sourcing reduction |
H1 2025 | 70.3% | +630bp vs H1 2024 | Overseas mix ~60%+; Labubu COGS scale231 |
FY2025 | 72.1% | +530bp | |
H1 2026 | 69.7% | -60bp | Overseas mix -0.9ppt, RM/logistics -0.7ppt, licensing +1.0ppt234235 |
The CFO explicitly attributed the H1 2026 gross margin decline to three quantified factors: overseas revenue mix reversal (-0.9ppt), higher raw material and logistics costs (-0.7ppt), partially offset by lower licensing fees (+1.0ppt).234235 The margin remains structurally elevated vs. the FY2022 trough.
Key Finding 3: Opex Leverage and Normalized Profitability — FX Loss Is the Key H1 2026 Distortion
Period | D&S % Rev | G&A % Rev | Total Opex % | Op. Margin | Non-IFRS Adj. Net Margin |
|---|---|---|---|---|---|
FY2022 | 31.8% | 14.9% | 46.7% | 12.6% | 12.4% |
FY2023 | 31.8% | 11.2% | 43.0% | 19.5% | 18.9%236 |
FY2024 | 28.0% | 7.3% | 35.3% | 31.9% | 26.1% |
FY2025 | 21.8% | 4.8% | 26.6% | 45.5% | |
H1 2025 | 23.0% | 5.6% | 28.6% | 43.5% | 33.9% |
H1 2026 | 22.9% | 5.4% | 28.3% | 39.2%* |
*H1 2026 operating margin includes RMB 688.8M net other losses (primarily the RMB 720.3M FX loss).238
G&A is substantially fixed: it grew only 3.1% in FY2023 on +36.5% revenue.236 D&S is sublinear: it grew +121.4% on +184.7% revenue growth in FY2025.237 Total opex leverage was ~870bp YoY in FY2025.
The FX loss is the critical H1 2026 margin distortion: The swing from a RMB 120.1M FX gain (H1 2025) to a RMB 720.3M FX loss (H1 2026) is an approximately RMB 840M pre-tax headwind — equivalent to ~490bp of net margin on the H1 2026 revenue base.235239 Normalized for this item, non-IFRS adjusted net margin approximates 34-35%, broadly consistent with FY2025 levels. The FX loss is a recurring structural cost that grows as the overseas balance sheet expands; it is not a one-time item.
Non-IFRS bridge remains single-item (SBC only). SBC was RMB 55.5M in H1 2026 vs. RMB 27.9M in H1 2025, reflecting grant timing.223
Key Finding 4: FCF Generation — Structural Base Strong, H1 2026 Compressed by Inventory Build and Capex Acceleration
Period | OCF (RMB M) | Capex (RMB M) | FCF (RMB M) | FCF Margin | CFO/NI |
|---|---|---|---|---|---|
FY2022 | 891 | 348 | ~543 | ~11.8% | 187% |
FY2023 | 1,991 | 393 | ~1,598 | ~25.4% | |
FY2024 | 4,954 | 517 | ~4,438 | ~34.1% | 158%242 |
FY2025 | 10,865 | 1,172 | ~9,694 | ~26.2% | |
H1 2025 | 5,977 | 375 | ~5,603 | ~40.4% | 131%245 |
H1 2026 | 3,637 | 724 | ~2,913 | ~17.0% |
FY2025 OCF of RMB 10.86B exceeded Citi Research's December 2024 forecast of RMB 4.31B by 152% — demonstrating the difficulty of modeling the LABUBU demand surge.248249
CFO/NI compression from 184% (FY2023) to 72% (H1 2026) reflects two transient forces: (1) inventory pre-build as a cash use (FY2025: RMB -3.93B inventory drain in OCF reconciliation)244; (2) FX loss runs through P&L/NI but the OCF reconciliation treatment differs, mechanically compressing the ratio.247
Capex composition caveat: Management defines capex as PP&E + intangible purchases only. IFRS 16 ROU asset additions (~RMB 452M of H1 2026 ROU depreciation on segment non-cash disclosure, plus new lease additions)250 are excluded — a structurally significant understatement of total economic capital commitment. Including IFRS 16 lease principal repayments, "economic FCF" is materially lower than the RMB 2.91B headline figure.
Management at the August 2026 earnings call: "供应链的新产线建设是接下来一两年的核心重点,通过更精益的生产,一方面优化成本,一方面从源头降低库存产生的可能性。出于品牌保护、也出于现有消费者的体验考虑,我们不会做大规模的促销活动。" (Supply chain new production line construction is the core priority for the next 1-2 years; no large-scale promotions to protect brand and FCF margins.)251
Key Finding 5: Working Capital — Inventory Overhang at 201 Days Is the Most Acute Near-Term Financial Risk
Period | Inv. Days | Rec. Days | Pay. Days | CCC | Inventory (RMB M) |
|---|---|---|---|---|---|
FY2022 | 156 | 12-15 | 49 | ~119 | 867 |
FY2023 | 133 | 15 | 53 | ~95 | 905 |
H1 2024 | 101 | 12 | 56 | ~57 | 917 |
FY2024 | 102 | 11 | 61 | ~52 | 1,525 |
H1 2025 | 83 | 10 | 73 | ~20 | 2,274 |
FY2025 | 123 | 7 | 51 | ~79 | |
H1 2026 | 201 | 8 | 48 | ~161 |
Inventory days improved consistently from 156 (FY2022) to 83 (H1 2025 trough), then reversed sharply. The H1 2026 CCC of ~161 days (vs. ~20 days in H1 2025) is the company's worst working capital position in its post-IPO history.
Root causes (per H1 2026 earnings call)253254:
Sales forecast errors from FY2025 hypergrowth — systematic overestimates for H1 2026 ordering
Americas operational failures: sharp sales volatility, internal system weaknesses, insufficient product development lead time for sea-freight logistics
Structural overseas expansion pre-stocking — longer international supply chains require earlier inventory positioning
Inventory aging (qualitative, earnings call)253255:
Over-2-year aged inventory: proportion slightly higher than Q1 2025 — most impairment-risk-sensitive bucket
Under-1-year (3-12 months, new/unreleased): grew sharply to end-2025, then showed double-digit percentage decline by Q1 2026 — early positive indicator
Management remediation plan253255:
Total inventory volume confirmed to have turned the corner from July 2026
Cross-regional inventory rebalancing (Americas overstock redirected to China where demand persists)
Order discipline: not chasing revenue targets through excess ordering
No large-scale promotions — explicit brand price protection commitment
Supply chain new production lines as 1-2 year core capex priority to reduce forecast-to-production lead time risk
Payables context: Payable days fell from 73 (H1 2025) to 48 (H1 2026) — mechanical, not structural. H2 2025 concentrated bulk procurement elevated year-end payables (RMB 1,858M at FY2025 year-end); by H1 2026 those were settled (RMB 905M).243252 Receivables remain best-in-class at 7-8 days, consistent with predominantly prepaid consumer model.
Key Finding 6: Net Cash, Capital Deployment, and PRC WHT Shadow Liability
FY2024 | FY2025 | H1 2026 | |
|---|---|---|---|
Cash & equivalents (RMB M) | 6,109 | 13,775 | 12,442 |
Term deposits 3M-1Y (RMB M) | — | 3,450 | 1,520 |
LT term deposits >1Y (RMB M) | — | — | 202 |
Total gross liquid assets (RMB M) | ~6,109 | ~17,225 | ~14,164 |
IFRS 16 lease liabilities (RMB M) | — | 2,862 | 3,728 |
Net cash (Note 34c method) | ~5,156 | ~10,923 | ~10,436 |
Bank borrowings | Nil | Nil |
Dividend track record:
Year | DPS (RMB) | Total Payout (RMB M) | IFRS NI Attributable (RMB M) | Payout % |
|---|---|---|---|---|
FY2023 | 0.2821 | ~373 | 1,082 | |
FY2024 | 0.8146 | ~1,083 | 3,125 | ~34.7%258 |
FY2025 | 2.3817 | ~3,149 | 12,776 | |
H1 2026 | Nil | Nil | — | No interim |
Note: The supplementary instruction references "FY2023-2024 actual payout ~11-12%" which likely reflects calculation against a "distributable profit" definition; the above ratios are calculated against IFRS attributable profit from filed accounts.
Share buybacks: H1 2026: 11.22M shares at HKD 141.4–194.9 for HKD 1,744.5M (~RMB 1,545.7M), all cancelled.261 March 2026: 3.94M shares at HKD 148.4–157.8 for HKD 599.7M.262 August 2026 new mandate: RMB 2–5B within 6 months.251
PRC Withholding Tax shadow liability: Undistributed PRC subsidiary earnings reached RMB 20,163.2M at end-FY2025 (up 255% from RMB 5,685.9M at end-FY2024). Theoretical shadow WHT: ~RMB 1.0B at 5% treaty rate; ~RMB 2.0B at 10% statutory rate. Directors have not recognized a deferred tax liability, as distribution is not probable in the foreseeable future.243 This is an unbooked, growing contingent obligation that structurally constrains the effective dividend yield from the HK listing level.
Fortress balance sheet context: Combined maximum capital return in 12 months (~RMB 8.2B = RMB 3.1B dividend + up to RMB 5B buyback) is comfortably within both annual FCF capacity and gross liquid assets of RMB 14.2B. IFRS 16 lease liabilities (RMB 3.73B) are retail store lease obligations, not financial debt.247
Short-Term Factors and Accounting Considerations
FX loss RMB 720.3M: Translation/transaction loss from multi-currency overseas balance sheet. Recurring and growing structural cost as overseas presence expands. Not a one-off.239
CFO/NI at 72%: Driven by inventory pre-build cash use and FX loss P&L mechanics — not indicative of a structural OCF deterioration.244247
Inventory 201 days: Partly mechanical (inflated COGS denominator from prior-year extraordinary volumes). Will compress as inventory falls or revenue grows.
Capex understatement: Stated RMB 724M H1 2026 capex excludes ROU asset additions. Economic FCF including IFRS 16 lease principal repayments is materially lower than the RMB 2.91B headline.250
Americas base effect: FY2025 Americas +748.4% was a TikTok/viral one-time demand surge; H1 2026 normalization is the baseline reset.226
Information Limitations
No standalone FY2022 annual report (data from FY2023 comparatives)
H1 2026 full interim report with note-level cash flow statement not yet published (preliminary announcement only)
IP-level or product-level gross margin not disclosed
"Distributable profit" definition underlying stated payout policy not publicly quantified
No peer benchmarking data (Funko, Sanrio, Bandai) available for working capital or margin comparison
IFRS 16 lease principal repayments for H1 2026 not separately disclosed in preliminary announcement
Balance Sheet Evolution Since IPO
Deep-dive analysis of Pop Mart's balance sheet structure and evolution from IPO (December 2020) through H1 2026, covering asset composition, liability structure, equity evolution, capital efficiency metrics (ROIC/ROE), and balance sheet quality assessment.
Analyze Pop Mart's balance sheet evolution since its IPO in December 2020 through H1 2026, covering: (1) asset composition and mix shift (current vs. non-current, cash/inventory/PP&E/ROU/intangibles); (2) liability structure evolution (operating leases IFRS 16, trade payables, deferred revenue, withholding tax contingency); (3) equity build-up (retained earnings, SBC, buybacks, dividend outflows); (4) capital efficiency metrics over time (ROIC, ROE, asset turnover); (5) balance sheet quality assessment including off-balance-sheet items and key accounting policy choices.
Pop Mart International (9992.HK) — Balance Sheet Evolution: IPO (December 2020) through H1 2026
Executive Summary
Pop Mart's balance sheet has undergone three structurally distinct phases since its December 2020 Hong Kong IPO. Phase 1 (FY2020–FY2022) saw the asset base dominated by IPO cash proceeds sitting in term deposits while revenues stagnated, compressing capital efficiency metrics sharply. Phase 2 (FY2023–FY2024) was a recovery period driven by organic free cash flow accumulation and a measured ramp in lease-financed store expansion. Phase 3 (FY2025–H1 2026) is characterised by hypergrowth: total assets reached RMB 32.1 billion at FY2025 (vs. RMB 8.6 billion at FY2022), equity more than tripled, and a deferred tax asset of RMB 1.75 billion emerged at year-end 2025 as a dominant new non-current item — alongside an unrecognised withholding tax contingency of up to RMB 2.0 billion on RMB 20.2 billion of mainland undistributed earnings. Throughout all phases, the company has carried zero financial debt; all "leverage" is purely operational via IFRS 16 lease obligations.266267268
Key Finding 1: Asset Base 4.5x in 5.5 Years — Three Distinct Structural Phases
Total assets grew from approximately RMB 6,971 million at FY2020 year-end (post-IPO) to RMB 32,101 million at FY2025 and RMB 31,028 million at H1 2026 — a 4.5x expansion in 5.5 years.269 The current vs. non-current split tells the story of three phases:
Table 1: Total Assets — Scale and Mix Evolution (RMB million)
FY2020 | FY2021 | FY2022 | FY2023 | FY2024 | H1 2025 | FY2025 | H1 2026 | |
|---|---|---|---|---|---|---|---|---|
Total Assets | 6,971 | 8,324 | 8,580 | 9,969 | 14,871 | 21,357 | 32,101 | 31,028 |
Current Assets | 6,256 | 6,757 | 6,616 | 7,683 | 12,236 | 17,851 | 24,915 | 22,092 |
Non-Current Assets | 715 | 1,566 | 1,965 | 2,285 | 2,635 | 3,506 | 7,187 | 8,936 |
NC% of Total | 10.3% | 18.8% | 22.9% | 22.9% | 17.7% | 16.4% | 22.4% | 28.8% |
Sources: 5-year summary tables in FY2025 and FY2024 ARs; H1 2025 and H1 2026 results announcements. FY2020–FY2021 totals only; line-item breakdown not available from audited primary source.
Phase 1 (FY2020–FY2022): The IPO injected approximately HKD 5,782 million (net proceeds) into the balance sheet, immediately flipping the current ratio to an elevated level. Non-current assets were only 10.3% of total assets at FY2020. Cash and term deposits jointly formed the dominant current asset.269
Phase 2 (FY2023–FY2024): Organic earnings began accumulating into the cash balance (cash + equivalents rose from RMB 685 million at FY2022 to RMB 6,109 million at FY2024).269 Non-current assets grew modestly as the lease network expanded; NC% remained stable at 17.7–22.9%.
Phase 3 (FY2025–H1 2026): The most dramatic expansion. Non-current assets surged from RMB 2,635 million (FY2024) to RMB 7,187 million (FY2025) in a single year — a 173% increase — driven by: (a) ROU assets tripling from RMB 928 million to RMB 2,791 million; (b) deferred tax assets exploding from RMB 147 million to RMB 1,754 million; and (c) PP&E growing from RMB 739 million to RMB 1,418 million.270
Table 2: Non-Current Asset Line Items (RMB million)
Item | FY2022 | FY2023 | FY2024 | H1 2025 | FY2025 | H1 2026 |
|---|---|---|---|---|---|---|
PP&E | 449 | 653 | 739 | 942 | 1,418 | 1,770 |
Intangibles | 147 | 116 | 135 | 207 | 209 | 236 |
ROU Assets | 702 | 726 | 928 | 1,367 | 2,791 | 3,603 |
Equity Investments | 83 | 107 | 137 | 107 | 128 | 159 |
FVTPL Financial Assets | 459 | 472 | 412 | 422 | 357 | 621 |
Deferred Tax Assets | 81 | 83 | 147 | 333 | 1,754 | 1,814 |
Restricted Cash (NC) | — | — | — | — | 256 | 224 |
LT Deposits / Other NC | — | — | — | — | 274 | 509 |
Total NC | 1,965 | 2,285 | 2,635 | 3,506 | 7,187 | 8,936 |
Sources: FY2025 AR Notes 14/15/16/19; FY2024 AR; H1 2026 results announcement.270271
The deferred tax asset of RMB 1,754 million at FY2025 is driven primarily by unrealised intra-group profits on inventory (RMB 1,603 million) and temporary differences on lease liabilities (RMB 729 million). These are mechanical IFRS accounting entries that reverse as inter-company inventory sells through to end customers — they should not be read as equivalent in quality to cash or tangible assets.
Current asset composition: The cash/term-deposit mix shifted structurally. At FY2022 the liquidity pool was term-deposit dominated (cash RMB 685 million, term deposits RMB 4,356 million). By FY2025 it was cash-dominated (cash RMB 13,775 million, term deposits RMB 3,450 million), reflecting IPO proceeds deployment and massive operating cash inflows from FY2024–FY2025 earnings. Inventories grew sharply: RMB 867 million (FY2022) to RMB 1,525 million (FY2024) to RMB 5,473 million (FY2025) to RMB 6,102 million (H1 2026).269272
Intangibles are notably small throughout (RMB 116–236 million), reflecting Pop Mart's policy of expensing variable IP royalties to P&L rather than capitalising them. This is consistent with IFRS but means IP relationships are not reflected on the balance sheet.
Key Finding 2: Lease Liabilities Are the Only "Debt" — Variable Rents Are the Hidden Off-Balance-Sheet Item
Pop Mart carries zero bank borrowings and has pledged no assets throughout the IPO-to-H1 2026 period.273274 All liability growth is attributable to IFRS 16 lease obligations and operating payables. The critical nuance is that balance sheet lease liabilities represent only the fixed minimum commitment portion of total lease economics. Revenue-linked variable rents (9–18% of store sales) are excluded from the lease liability under IFRS 16 and flow directly to the P&L as incurred.275
Table 3: IFRS 16 Full Economic Cost — On and Off Balance Sheet (RMB million)
Period | ROU Assets | Lease Liabilities | ROU Depreciation | Lease Interest | Variable + Short-term Lease P&L | Total IFRS 16 Economic Cost |
|---|---|---|---|---|---|---|
FY2022 | 702 | 741 | 330 | 34 | 41 | ~405 |
FY2023 | 726 | 778 | 348 | 31 | 186 | ~565 |
FY2024 | 928 | 965 | 452 | 43 | 458 | ~953 |
FY2025 | 2,791 | 2,862 | 593 | 82 | 1,338 | ~2,013 |
H1 2026 | 3,603 | 3,728 | 452 (H1) | 81 (H1) | 673+ (H1) | ~1,044+ (H1) |
Sources: FY2023 AR IFRS 16 note; FY2025 AR Note 16; H1 2026 results announcement.276277278279
The variable lease P&L charge grew from RMB 41 million in FY2022 to RMB 1,128 million in FY2025 — a 27-fold increase in three years. In H1 2026, lease-related costs reached RMB 1,044 million (+43.3% vs. H1 2025), tied to 105 net new offline stores opened vs. H1 2025.280
Table 4: Key Liability Line Items (RMB million)
Period | Trade Payables | Contract Liabilities | Lease Liab (curr) | Lease Liab (NC) | Current Tax Payable | Total Liabilities | Gearing (TL/TA) |
|---|---|---|---|---|---|---|---|
FY2022 | 259 | 89 | 294 | 448 | 47 | 1,615 | 18.8% |
FY2023 | 445 | 112 | 352 | 426 | 115 | 2,188 | 22.0% |
FY2024 | 1,010 | 189 | 363 | 601 | 562 | 3,986 | 26.8% |
H1 2025 | 1,628 | 855 | 415 | 996 | 1,034 | 6,927 | — |
FY2025 | 1,858 | 393 | 586 | 2,275 | 2,116 | 9,449 | 29.4% |
H1 2026 | 905 | 513 | 666 | 3,062 | 623 | 7,740 | 24.9% |
Sources: FY2025 AR balance sheet; FY2024 AR; H1 2026 results announcement.266273274281
Notable observations: Trade payables rose 7x from FY2022 to FY2025, then fell sharply to RMB 905 million in H1 2026 reflecting seasonal supplier payment patterns.282 Contract liabilities spiked anomalously to RMB 855 million at H1 2025 (vs. RMB 189 million at FY2024), likely reflecting advance deposits for Labubu restocking, before normalising to RMB 393 million at FY2025 year-end. Current income tax payable surged 46-fold from RMB 47 million (FY2022) to RMB 2,116 million (FY2025).283 Gearing (Total Liabilities / Total Assets) rose from 18.8% (FY2022) to 29.4% (FY2025), driven entirely by IFRS 16 lease liabilities; under a net-debt definition the company has zero net debt throughout.273274281
Withholding tax contingency: Per IAS 12 para. 39, directors assess repatriation as "not probable," so no deferred tax liability is accrued. Undistributed earnings of mainland China subsidiaries grew from RMB 2,040 million (FY2022) to RMB 20,163 million (FY2025).284285 At a 5% treaty rate, the implied contingent WHT exposure is approximately RMB 1,008 million (~5.4% of FY2025 equity). At the statutory 10% rate, the exposure doubles to ~RMB 2,016 million.284285
Key Finding 3: Equity Build-Up — Retained Earnings Drive a 3x Expansion; H1 2026 Other Reserves Turn Negative
Total equity grew from approximately RMB 7,600 million at IPO to RMB 23,288 million at H1 2026. Cumulative net profit attributable to owners (FY2021–H1 2026) of approximately RMB 23.5 billion was the dominant force; this was partially returned via dividends (~RMB 5.1 billion cumulative) and buybacks (~RMB 2.6 billion cumulative).
Table 5: Annual Equity Bridge — Key SOCIE Components (RMB million)
Period | Opening Equity | Profit (Group) | CTA | Buybacks | Dividends Declared | SBC | Closing Equity | Retained Earnings |
|---|---|---|---|---|---|---|---|---|
FY2022 | 6,820 | 476 | +411 | (634) | (209) | +102 | 6,965 | 2,269 |
FY2023 | 6,965 | 1,089 | +75 | (334) | (117) | +102 | 7,780 | 3,331 |
FY2024 | 7,780 | 3,308 | +152 | (78) | (373) | +95 | 10,885 | 6,402 |
FY2025 | 10,885 | 13,012 | (180) | nil | (1,083) | +77 | 22,652 | 19,154 |
H1 2026 | 22,652 | 5,100 | — | (1,546) | (3,149) | +55 | 23,288 | 24,190 |
Sources: FY2024 AR SOCIE p.193-195286; FY2025 AR SOCIE p.223-225287; H1 2025 interim report SOCIE p.57-59288; H1 2026 results announcement.289290
FY2022 buybacks (RMB 634 million) represented ~133% of FY2022 net profit — a significant capital return funded by IPO cash reserves. FY2025 saw zero buybacks but a large dividend: RMB 1,083 million paid in 2025 (FY2024 final) plus the board recommended RMB 3,194 million for FY2025 (RMB 2.3817/share).291 H1 2026 compressed equity from both sides: RMB 3,149 million dividend paid plus RMB 1,546 million in buybacks (11.22 million shares at HKD 141.4–194.9/share, all cancelled), reducing shares outstanding from 1,342,943,150 to 1,331,723,150.292 Other reserves turned negative (–RMB 1,132 million) at H1 2026 as cumulative buyback charges against share premium exceeded the IPO share premium balance — a mechanical accounting outcome.
SBC trajectory:
Period | SBC P&L Charge (RMB million) | RSUs Outstanding (thousand) |
|---|---|---|
FY2022 | ~97–102 | — |
FY2023 | 101.7 | declining |
FY2024 | 94.8 | 10,609 → 7,213 |
FY2025 | 76.6 (employees 71.6 + vendor 5.0) | 7,213 → 3,564 |
H1 2025 | 27.9 | — |
H1 2026 | 55.5 | New grants ongoing |
Sources: FY2025 AR Note 28294295; H1 2026 results announcement.296
SBC declined from ~RMB 102 million to RMB 77 million (FY2022–FY2025) as the legacy RSU pool vested. However, H1 2026 SBC of RMB 55.5 million (vs. H1 2025's RMB 27.9 million) reflects new grants made in May, July, and August 2026. The Post-IPO Share Award Scheme adopted July 24, 2020 has a 10-year duration; new grants continue, so the SBC will not fall to zero near-term.293294295296
Distributable reserves remained positive throughout: RMB 11,359 million (FY2024)297 and RMB 10,503 million (FY2025)298 — confirming no dividend sustainability risk.
Key Finding 4: Capital Efficiency — U-Shaped ROIC; Asset Turnover is the Primary Driver
Table 6: Capital Efficiency Metrics
Period | Asset Turnover | Post-tax EBIT Margin (Citi) | ROIC (Citi) | ROE (StockAnalysis) | Inventory Days | Payable Days |
|---|---|---|---|---|---|---|
FY2018 (pre-IPO) | 3.5x | 19.7% | 68.0% | — | — | — |
FY2019 (pre-IPO) | 4.1x | 27.0% | 112.2% | — | — | — |
FY2020 | 0.7x | 21.1% | 15.8% | — | — | — |
FY2021 | 0.7x | 18.9% | 13.1% | 13.2% | — | — |
FY2022 | 0.7x | 9.8% | 6.6% | 6.9% | 156 | 49 |
FY2023 | 0.9x | 15.4% | 13.2% | 14.8% | 133 | 53 |
FY2024 | 1.4x | 20.4% | 27.8% (est.) | 35.5% | 102 | 61 |
FY2025 | 1.5x+ | 21.8% (est.) | 30.9% (est.) | 77.6% | 123 | 51 |
H1 2026 | — | — | — | — | 201* | 48 |
H1 2026 inventory days computed on annualised half-year basis; not directly comparable to full-year figures.
Sources: Citi Research initiation Dec 2024299; StockAnalysis; company filings.300301302303
The dominant driver of ROIC recovery was asset turnover, rising from 0.7x (FY2020–FY2022, when IPO proceeds sat idle) to 1.4–1.5x by FY2024–FY2025 as revenue scaled. Margin expansion (from 9.8% in FY2022 to ~21–22% from FY2024) was the secondary driver.299
Inventory days improved from 156 days (FY2022) to 102 days (FY2024), then re-inflated to 123 days (FY2025) and 201 days (H1 2026, annualised). Management explicitly attributed the H1 2026 inventory pressure to forecast errors from the prior year's hypergrowth: "过去大半年经历了比较大的库存压力,主要源自去年高速增长带来的销售预测偏差."304
Capex tripled from RMB 392 million (FY2023) to RMB 1,172 million (FY2025), and H1 2026's RMB 724 million already exceeds full-year FY2023.305306307 This reflects the aggressive global store rollout: 109 net new stores in FY2025, 105 net new stores in H1 2026 vs. H1 2025.
Key Finding 5: Balance Sheet Quality — Zero Bank Debt, Two Material Off-Balance-Sheet Items
Strengths: Zero bank borrowings and no pledged assets across the entire post-IPO period.273274281 Net cash strongly positive (cash + term deposits RMB 17.2 billion at FY2025; RMB 14.0 billion at H1 2026). Distributable reserves confirmed positive. Current ratio consistently above 3.5x throughout.
Off-balance-sheet item 1 — Variable IFRS 16 lease commitments: Lease liabilities (RMB 2,862 million at FY2025; RMB 3,728 million at H1 2026) capture only fixed minimum rent commitments. Variable revenue-linked rents (9–18% of store sales) add a further economically real obligation scaling with revenue. In FY2025 these variable + short-term lease charges reached RMB 1,338 million — 47% as large as ROU depreciation and 3x the FY2024 figure.277278 The accounting policy note states: "Variable lease payments that depend on sales are recognised in profit or loss in the period in which the condition that triggers those payments occurs."275
Off-balance-sheet item 2 — Withholding tax contingency: RMB 20,163 million of undistributed mainland earnings at FY2025 implies RMB 1,008–2,016 million contingent WHT exposure (5–10%) not recognised on the balance sheet. Non-recognition basis is the IAS 12 para. 39 "parent controls timing" exemption; directors assess repatriation as not probable.284285
Key accounting policy choices:
IFRS 16 full adoption; variable rents excluded from capitalisation — material given the scale of revenue-linked leases.275
IAS 12 WHT exemption — no DTL recognised on mainland undistributed earnings.284285
IFRS 2 SBC — fair value at grant date expensed over vesting period via Share Award Trust (Pop Mart Partner Limited, consolidated as SPE).308
Inventory — finished goods only (100% outsourced manufacturing); no raw materials or WIP.
Deferred tax asset of RMB 1,754 million at FY2025 dominated by intra-group unrealised inventory profits (RMB 1,603 million) — a temporary difference reversing as inventory sells through.
IPO proceeds — HKD 5,782 million net proceeds; 95.8% deployed as of June 30, 2026; HKD 563 million reallocated from "acquiring IP library" to "overseas + theme park IP commercialisation platform."309
Post-period event (subsequent to H1 2026 balance sheet date): CEO Wang Ning announced RMB 2–5 billion buyback program over 6 months following the H1 2026 results release on August 20, 2026.
Short-term / One-time Factors and Comparability Notes
H1 inventory days use annualised (half-year COGS × 2) denominators; H1 2026 at 201 days and H1 2025 at 83 days are not directly comparable to full-year figures (FY2024: 102 days, FY2025: 123 days).300301303
Deferred tax asset of RMB 1,754 million at FY2025 inflates non-current assets via intra-group inventory accounting; reverses as overseas inventory sells through (still RMB 1,814 million at H1 2026, suggesting the overhang had not cleared).270
H1 2025 contract liabilities spike to RMB 855 million was a seasonal/order-cycle effect, reversing to RMB 393 million by FY2025 year-end.
FY2025 equity surge from RMB 10,885 million to RMB 22,652 million was driven by RMB 13,012 million in net profit from a single hypergrowth year; equity accumulation rate will normalise at lower growth.
Other reserves negative at H1 2026 (–RMB 1,132 million) is a mechanical buyback-against-share-premium accounting outcome; distributable reserves remain positive.
Information Sources and Limitations
Information limitations:
FY2020 and FY2021 annual reports absent from local database; detailed line-item balance sheets unavailable. Total asset figures sourced from 5-year summaries in later ARs.
FY2022 annual report not in local database; FY2022 line items sourced from FY2023 AR comparatives.
ROIC for FY2025 and H1 2026 not independently recalculated from audited NOPAT; Citi (Dec 2024 estimates) and StockAnalysis figures cited with methodology caveat — the two sources use different invested capital definitions.
Full H1 2026 IFRS notes (lease maturity schedule, full WHT disclosure, complete DTA note) not available from interim announcement format.
IPO proceeds: HKD 5,782 million (audited company deployment table) is used as the authoritative figure throughout; earlier estimates of HKD 4.57 billion (pre-greenshoe) or HKD 5.25 billion (gross) are noted as less reliable.309
Risks & Bear Case
IP concentration risk, China consumer slowdown, counterfeiting, blind box regulation risks
What are the key risks and bear case scenarios for Pop Mart? Cover IP concentration, China consumer slowdown, counterfeiting, and blind box regulation.
Pop Mart (9992.HK) — Key Risks and Bear Case Scenarios
Executive Summary
Based on primary filings (H1 2026 earnings call, May 2026 AGM, FY2024/FY2025 annual reports) and the Citi Research broker initiation, Pop Mart's risk profile as of H1 2026 centers on four structurally linked dimensions: (1) extreme IP revenue concentration in a single exclusively-licensed franchise (Labubu/THE MONSTERS) that has entered visible demand decline overseas; (2) a China consumer base that is employment-sensitive, repeat-purchase-dependent, and carries a large fixed-cost store network; (3) an escalating counterfeiting ecosystem whose scale now exceeds enforcement capacity; and (4) a blind-box regulatory framework with documented precedent for escalation. These risks are not independent — Labubu demand normalization shrinks the overseas margin buffer that absorbs China consumer weakness; counterfeiting erodes the scarcity premium that sustains blind-box demand; and regulatory risk is most acute precisely when the secondary market speculative premium has already collapsed.
Key Finding 1: THE MONSTERS IP Concentration Has Reached a Historical Extreme, and H1 2026 Confirms Demand Cycle Reversal
THE MONSTERS revenue share accelerated from 5.8% of group revenue (FY2023) to 23.3% (FY2024) to 38.1% (FY2025)310311 — the highest single-IP concentration since the IPO — before retreating to 26.0% in H1 2026312. The retreat from H1 2025's 34.7% to H1 2026's 26.0% is a -8.7 percentage-point decline within a single year. This trajectory mirrors prior IP cycles:
IP Era | Peak Year | Peak Revenue Share | H1 2026 Share |
|---|---|---|---|
MOLLY | 2018 | ~42% | 5.3% |
SKULLPANDA | 2022-2023 | ~16% | 9.0% |
THE MONSTERS (Labubu) | FY2025 | 38.1% | 26.0% |
Citi Research documents MOLLY's arc: from 42% of revenue (2018) to 16% (2023)313. Each era has a dominant IP; each fades as the next rises.
The critical structural risk is that THE MONSTERS — unlike MOLLY and SKULLPANDA — is an exclusively licensed IP, not a proprietary one. Per Citi Research, the initial exclusive license term is 4 years, extendable to 6+ years based on market performance314. Pop Mart does not own the IP outright. If the license is not renewed, or if terms are renegotiated at materially higher cost reflecting Labubu's commercial success, Pop Mart's largest revenue IP faces cost escalation or loss.
Pop Mart's own FY2024 Annual Report acknowledges this risk316:
"We may not realize the full benefit of our licenses if the IPs we are granted license have less market appeal than expected or if sales from the products that use those IPs are not sufficient to satisfy the minimum guaranteed royalties."
CEO Wang Ning acknowledged at the May 2026 AGM that IP incubation is inherently slow317:
"MOLLY is 20 years old, Labubu is 11 years old. An IP or a business needs a very slow incubation process. We cannot say that today we launch a new IP or new business that will overturn traditional business or instantly compete with the main large IPs."
This confirms management's own view that no pipeline replacement equivalent to Labubu's global breakout is immediately available.
IP licensing department downgrade (structural signal): At the May 2026 AGM, Wang Ning disclosed that the IP licensing department is being reorganized from an independent unit to a sub-function under marketing318319:
"我们把原来授权部门……现在是不是放到比如说类似于市场部门下面,它是一个市场行为,而不是一个简单这个只是授权的这样一个行为。"
Wang Ning frames this as an "iOS closed ecosystem" model rather than Disney-style open licensing320. The practical implications: (a) licensed IP revenue (10.3% of H1 2026 group revenue321) loses its dedicated commercial advocate; and (b) the department that coordinated third-party enforcement oversight is now subordinate to marketing, potentially reducing enforcement resources.
Key Finding 2: Overseas Revenue Has Already Declined (-11% YoY) — First-Ever Decline, Confirming Labubu Demand Cycle Reversal
H1 2026 marks the first-ever period of overseas revenue decline for Pop Mart. CFO Yang Jinbing stated directly322:
"一方面拉布布在海外热度下降,导致海外收入同比下滑约11%,规模效应减弱、单店效率有所回落。从目前情况看,2026年海外市场经营利润率会出现下滑。"
Online channels saw the sharpest declines: Americas online -45.6%, Europe online -59.0%. CEO Wang Ning acknowledged the 20% growth target is at risk322:
"综合来讲,我们承认今年的困难比想象中大,也有可能会完不成既定的20%营收增长预期。"
The gross margin bridge for H1 2026: overseas revenue mix decline contributed -0.9 pct, raw material cost increases -0.7 pct, partially offset by licensing fee declines +1.0 pct, for a net gross margin decline of -0.6 pct to 69.7%322. As overseas share fell from 40.3% (H1 2025) to 29.0% (H1 2026), and overseas gross margin runs ~7-9 pct higher than China (FY2024: China offline 66.4%, overseas ~72-73%), further China share increases mechanically compress group margins.
Regional Revenue: H1 2025 vs H1 2026
Region | H1 2026 Revenue | Share H1 2025 | Share H1 2026 | Direction |
|---|---|---|---|---|
China Mainland | RMB 12.18 bn | 59.7% | 71.0% | +47.1% YoY |
Asia-Pacific ex-China | RMB 2.58 bn | — | 15.0% | Declining |
Americas | RMB 1.89 bn | — | 11.0% | -16.5% (est.) |
Europe | RMB 0.51 bn | — | 3.0% | Declining |
Total | RMB 17.17 bn | 100% | 100% | +23.8% |
Inventory turnover days jumped from 83 (H1 2025) to 201 (H1 2026), driven by demand forecast errors during rapid growth. Management states inventory peaked in July 2026. Pop Mart will not discount to clear inventory323:
"出于品牌保护、也出于现有消费者的体验考虑,我们不会做大规模的促销活动。"
The refusal to discount protects brand equity but extends inventory clearance timelines, creating a cash drag. Supply chain mitigation is underway: management is accelerating overseas factory buildout to supply overseas markets from non-China-origin production346347, and consolidating overseas warehousing and logistics.
Key Finding 3: China Consumer Slowdown — Sentiment-Sensitive Demographic, Fixed Cost Leverage, Repeat-Purchase Dependence
Pop Mart's China business (71.0% of H1 2026 revenue) carries structural vulnerabilities to consumer sentiment deterioration. Citi Research characterizes the category as "spiritual consumption" — Gen Z and millennial purchasers motivated by cultural identity rather than utility324. China pop toy per-capita spend of RMB 51 vs. a global average of RMB 227324 reflects nascent, sentiment-driven demand.
Three structural mechanisms link China consumer slowdown to earnings downside:
1. Repeat-purchase dependence: Members contributed 92.7% of China revenue (FY2024) at a repeat purchase rate of 49.4% (FY2024) rising to 50.8% (H1 2025)325. The core demographic is women aged 20-40326 — employment-sensitive and discretionary in their spending. Any decline in visit frequency disproportionately impacts revenue.
2. Fixed-cost leverage: As of FY2024, China's network comprised 401 retail stores and 2,300 roboshops327. Rent and labor are semi-fixed over lease terms. The H1 2026 store upgrade program — over 20 stores relocated/renovated — demonstrates that per-store productivity is a recognized concern328.
3. High-beta valuation: Citi Research (Dec 2024) set its target at 35x 2025E P/E vs. MINISO at 19.7x329. If China consumer demand decelerates and/or overseas revenue continues to decline, multiple compression from "growth stock" to "consumer" equivalents (12-18x P/E) represents additional downside beyond fundamental earnings risk.
Historical stress test: in FY2022 (COVID lockdowns), net margin fell to 10.3% vs. 19.0% in FY2021330. Non-IFRS net margin peaked at ~33.9% in H1 2025. The FY2022 trough provides the most useful historical comparable for a stress scenario.
Key Financial KPIs (Multi-Period)
Metric | FY2022 | FY2024 | H1 2025 (Peak) | H1 2026 |
|---|---|---|---|---|
Group Revenue (RMB bn) | — | 13.0 | 13.88 | 17.17 |
Gross Margin | — | — | 70.3% | 69.7% |
Non-IFRS Net Margin | 10.3% | — | 33.9% | 30.0% |
China Member Sales % | — | 92.7% | 91.2% | 92.9% |
Repeat Purchase Rate | — | 49.4% | 50.8% | 51.6% |
Inventory Turnover Days | — | ~102 | 83 | 201 |
Key Finding 4: Counterfeiting Has Reached Industrial Scale — 12 Million Units Intercepted in 2025, Enforcement Structurally Insufficient
Pop Mart's FY2025 Annual Report provides the clearest quantification yet332:
"In 2025, we identified more than 100 forged authorization letters, took down the domain names of 21 overseas websites selling infringing products, initiated 430 infringement lawsuits, and successfully intercepted over 12 million infringing products at customs."
As of 31 December 2025, Pop Mart holds 1,995 copyrights, 11,721 trademarks, and 67 patents — with 9,744 new trademark applications in 2025 alone, signaling active trademark squatting requiring continuous defensive registration.
The 12 million intercepted units is a minimum bound. The counterfeit products operate under the consumer name "Lafufu" — indicating sufficient market penetration to have developed their own brand identity. A US CPSC safety warning (August 2025) explicitly linked counterfeit Labubu products to choking hazards and toxic materials, creating a brand reputation risk even though the defective products are not Pop Mart's.
Three Counterfeiting Mechanisms and Business Impact
Mechanism | Evidence | Business Impact |
|---|---|---|
Grey-market substitution | AGM 2026 shareholder Q: hot IPs sold out officially but available on e-commerce at small premium333 | Diverts store traffic; removes cross-sell opportunity |
Counterfeit substitution | CPSC safety warning; CBP seized 11,000+ units at Seattle (Sep 2025) | Brand reputation damage; buyer confusion; first-purchase trust erosion |
Secondary market collapse | Labubu "Luck" peaked >RMB 500 (Jun 2025), fell to ~RMB 108 by Oct 2025 (-78%) | Scarcity premium collapse reduces primary-market investment incentive |
Pop Mart has built formal enforcement infrastructure — dedicated overseas brand protection teams, graded infringement treatment, global trademark monitoring334335 — but two structural constraints limit effectiveness: (a) the scale of infringement (430 lawsuits and 12 million+ units in one year) exceeds what any brand-level legal team can fully suppress; and (b) the licensing department downgrade318319 signals reduced organizational priority for IP protection. CEO Wang Ning acknowledged in the 2024 interview book that steel-mold manufacturing adds only a modest barrier to counterfeit production336.
Management did not directly address a shareholder's AGM question about counterfeit/grey market availability on e-commerce platforms333 — suggesting no effective near-term solution has been identified.
Key Finding 5: Blind Box Regulation — Documented Framework With Escalation Risk, Partially Mitigated by Product Mix Shift
China's SAMR issued the "Guidelines for Blind Box Business Operation (trial)" in June 2023, with five key provisions338: (1) ban on sales to minors under age 8; (2) mandatory guardian consent for ages 8+; (3) restrictions on blind box proximity/content near primary schools; (4) mandatory public display of odds; (5) encouraged purchase volume limits and minimum guarantee mechanisms for hidden editions.
Citi Research flags gaming and e-cigarette regulatory precedents — sectors that received initial guidance before more restrictive sector-wide rules were enacted339. The escalation risk is further illustrated by the June 2025 People's Daily editorial calling for tighter regulation, which triggered a 12.1% stock decline in the week of June 20, 2025.
The two dimensions of regulatory demand risk:
Direct restriction: Mandatory minimum guarantee mechanisms for hidden editions (1:144 odds, reselling at 10x+ in secondary markets340) would compress scarcity premium significantly. Any volume cap would reduce the gamified repeat-purchase mechanic central to blind-box economics.
Secondary market risk: Citi Research: "Further limitation on secondary market trading, if any, could also reduce the demand for this product category."339 Given that the Labubu secondary market has already collapsed (-78% peak to October 2025), regulatory pressure on secondary market trading compounds an already-weakening demand signal.
Product Mix Shift (Structural Hedge)
Product Category | FY2023 | FY2024 | FY2025 | H1 2026 |
|---|---|---|---|---|
Figure Toys (incl. blind boxes) | ~76.1% | 53.2% | 32.4% | ~30.2% |
Plush Toys | ~3.2% | 21.7% | 50.4% | 57.2% |
MEGA + Others | ~20.7% | 25.1% | 17.2% | ~12.6% |
The shift from ~76% to ~30% in figure toy revenue over three years materially reduces Pop Mart's direct exposure to blind-box-specific regulation341342343. Plush products (RMB 9.83 billion, +60%, 57.2% of H1 2026 revenue344) are not subject to the same odds-disclosure and age-restriction framework.
Pop Mart has confirmed compliance with existing consumer protection frameworks: mandatory 7-day no-reason return for blind boxes, product safety inspections (100% pass rate), and age warning labeling across all markets345.
Bear Case Scenario Summary
Risk Dimension | Bear Case Scenario | Key Trigger |
|---|---|---|
IP Concentration | THE MONSTERS share continues declining to ~15-18% by FY2027 with no successor IP proven in Western markets; Pucky series blocked in US (Ty Inc. injunction) | No new cross-cultural IP breakout; license renewal terms deteriorate |
Overseas Demand Cycle | Overseas revenue falls further 15-20% in H2 2026 / FY2027; overseas operating margin turns negative in Americas/Europe | Labubu demand normalization not offset by SKULLPANDA or any new IP |
China Consumer | Repeat purchase rate falls 3-5 ppt; per-store traffic declines; operating deleverage on fixed store network | Youth unemployment rises; discretionary spending contracts |
Counterfeiting | Counterfeit proliferation suppresses official channel demand; Ty Inc. precedent emboldens other IP holders to challenge Pop Mart designs in US courts | Enforcement costs escalate; further US IP challenges |
Blind Box Regulation | SAMR formalizes trial guidelines into binding rules; secondary market trading restricted | Government response to auction scandals; media pressure |
Valuation | P/E multiple compresses from ~23x (post-FY2025 earnings) to 12-15x as growth stock narrative breaks down | FY2026 revenue declines; earnings miss for second consecutive year |
Sell-Side Bear Case Reference:
Deutsche Bank: FY2026 revenue RMB 36.5 billion (-2% YoY), adjusted net profit RMB 11.5 billion (-12% YoY), target HK$140 (14x 2026E P/E)
Morgan Stanley: Cut overseas revenue forecasts -18-19% for 2026-2028; new target HK$247
Morningstar (Jeff Zhang): Material Q4 2025 slowdown amplifies durability concerns; earnings missed consensus
Information Sources, Limitations, and Pending Conflicts
Key information gaps:
Ty Inc. (Beanie Babies) preliminary injunction (June 2026) vs. Pucky series: Not in local company filings; no HKEX announcement filed
THE MONSTERS exclusive license expiration date: Not publicly disclosed
Labubu secondary market price data (RMB 500 → RMB 108): Sourced from internet research (Qiandao platform), not local primary filings
China quarterly same-store sales growth: Management provides directional commentary only, no numerical SSSG disclosed
Pending conflict (CONFLICT-8 from reconciliation): EBs citing "dividend cut from 35% to 25%" — per wiki SSOT, 35% was a prior stated policy target; actual FY2023-2024 payout was 11-12%; FY2025 payout at 25% represents an increase vs. prior-year actuals, not a reduction.
Valuation & Margin of Safety
Peer multiples, DCF scenarios, and entry price framework
Value Pop Mart using peer multiples, DCF scenarios, and build an entry price framework with margin of safety analysis.
Pop Mart (9992.HK) — Valuation Framework: Peer Multiples, DCF Scenarios, and Entry Price with Margin of Safety
Executive Summary
As of August 17, 2026, Pop Mart trades at HKD 153.50 (TTM PE 14.4x, EV/EBITDA 9.17x), a 43-52% decline from its 52-week highs, reflecting a 2026 growth deceleration and IP cycle risk rather than a fundamental business deterioration — H1 2026 revenue grew +23.8% YoY to RMB 17.17 billion, with gross margins of 69.7% and ROIC of 157.1%.348349 The current multiple represents a 46% discount to Sanrio (PE 26.5x, EV/EBITDA ~17x) and a 54% discount to Games Workshop (PE 30.1x, EV/EBITDA 19.8x) despite Pop Mart having broadly comparable or superior gross margins and ROIC.350 A tiered entry price framework — anchored on three DCF scenarios, peer multiple cross-checks, and net cash of ~HKD 11.7/share351 — places base case intrinsic value at HKD 151-193, bear case at HKD 104-123, and bull case at HKD 233-263.
Key Finding 1: Pop Mart Trades at a Structural Discount to IP-Purity Peers Despite Superior Margins and ROIC
The most significant valuation observation is the gap between Pop Mart's margin and return profile and the multiple assigned by the market. As of August 17, 2026350:
Company | TTM PE | Fwd PE | EV/EBITDA | EV/EBIT | Gross Margin | Op Margin | Net Margin | ROIC |
|---|---|---|---|---|---|---|---|---|
Pop Mart (9992.HK) | 14.4x | 12.7x | 9.2x | 9.8x | 72.1% | 45.9% | 34.4% | 157% |
Sanrio (8136.T) | 26.5x | 22.2x | ~17x | 16.8x | 76.8% | 39.5% | 27.6% | 123% |
Games Workshop (GAW.L) | 30.1x | 30.3x | 19.8x | 22.0x | 72.5% | 41.7% | 31.2% | 99% |
Disney (DIS) | 21.4x | 13.9x | 10.5x | 14.2x | 37.6% | 15.6% | 8.7% | 7% |
Bandai Namco (7832.T) | 24.2x | 22.6x | 12.6x | 15.7x | 40.0% | 14.0% | 10.0% | 31% |
Hasbro (HAS) | 16.1x | n/m | 11.0x | 12.9x | 73.0% | ~25% | ~17% | n/a |
Mattel (MAT) | 10.3x | n/a | 7.4x | 10.8x | 49.0% | 10.0% | 8.0% | n/a |
MINISO (MNSO) | ~12x adj. | n/a | ~7x | ~9x | 45.0% | 15.4% | 5.6% GAAP | n/a |
Sources: StockAnalysis, Multiples.vc (Aug 17, 2026); Mattel 10-K FY2025352; MINISO 20-F FY2025353.
Pop Mart operates at operating margins (45.9%) and ROIC (157.1%) substantially above Sanrio's (39.5% / 123.2%) and Games Workshop's (41.7% / 98.6%), yet trades at 46-54% discounts on EV/EBITDA. The discount is structurally driven by three factors:
IP ownership structure: Pop Mart's core IPs (MOLLY, SKULLPANDA, THE MONSTERS/LABUBU) are exclusively licensed from artists — not fully owned. The company holds exclusive rights but does NOT own the underlying IP, and license renewal risk is real. Sanrio and GAW own 100% of all IPs outright.354355 As of H1 2026, proprietary and exclusive artist IPs accounted for 99.3% of sales; licensing fee expense fell to RMB 376 million (2.2% of revenue) from RMB 451 million (3.3%) in H1 2025, reflecting improving mix.356
IP concentration and cycle risk: Labubu (THE MONSTERS) contributed ~25% of H1 2026 revenue (down from 50%+); Labubu 4.0 secondary market prices crashed to CNY 50 (vs. CNY 159 retail) per Deutsche Bank (July 2026).357 By contrast, Sanrio's Hello Kitty is now only 37% of revenues after 50+ years — diversification is well-advanced.359
DTC retail model vs. pure licensing: Pop Mart is a DTC physical retailer (676 stores, 2,827 roboshops as of June 30, 2026)358; Sanrio is ~80%+ pure royalty licensing with zero inventory risk and near-100% gross margin on the licensing line.
Key Finding 2: Verified Financial Base for DCF — H1 2026 Actuals
The upstream evidence-reconciliation confirmed the following verified figures from the official HKEX filing (file 247933, August 20, 2026):
Metric | H1 2026 Actual | H1 2025 Actual | YoY |
|---|---|---|---|
Revenue (RMB M) | 17,173 | 13,876 | +23.8% |
Gross Margin | 69.7% | 70.3% | -0.6ppt |
EBIT (RMB M) | 6,725 | 6,042 | +11.3% |
EBITDA (RMB M) [derived]360 | 7,546 | ~6,614 | +14.1% |
EBITDA Margin | 43.9% | ~47.7% | -3.8ppt |
Non-IFRS Adj. Net Profit (RMB M) | 5,156 | 4,710 | +9.5% |
Non-IFRS Adj. Net Margin | 30.0% | 33.9% | -3.9ppt |
Operating Cash Inflow (RMB M) | 3,637 | — | — |
Capex (RMB M) | 724 | 375 | +93% |
FCF (RMB M) [derived]365 | 2,913 | — | — |
Net Cash (RMB M) | ~14,164 | — | — |
Inventory Days | 201 | ~83 | elevated |
Non-IFRS definition (reconciliation-verified): GAAP profit plus SBC only. FX losses are NOT excluded. The RMB 720 million FX loss (vs. +RMB 120 million gain in H1 2025, a swing of RMB 840 million) is the primary driver of profit growth lagging revenue growth.349 A normalized bridge stripping FX gives ~RMB 5,503 million at ~32.0% margin.361
Gross margin bridge (CFO-disclosed): Overseas mix decline (-0.9ppt) + raw material/logistics inflation (-0.7ppt) + royalty fee reduction and other offsets (+1.0ppt) = net -0.6ppt.356
Management signal (H1 2026 earnings call): CEO Wang Ning stated 2026 is an "adjustment year" and the full-year 20% revenue growth target will likely be missed; H2 2026 under "significant pressure" vs. high prior-year base. RMB 2-5 billion buyback over next six months announced; no interim dividend.
Key Finding 3: DCF — Three-Scenario Model
The DCF uses 10 explicit years with terminal value. At WACC 11.5% over 10 years, terminal value represents 55-65% of total enterprise value. A 1ppt change in terminal growth rate implies ~HKD 20-30/share; 1ppt WACC change implies ~HKD 25-40/share.362
WACC construction363: Risk-free rate ~2.4% (blended China 10yr CGB) + ERP 7.4% (Damodaran Aug 2026) x beta 1.2 (estimated) = cost of equity ~11.3%. Capital structure: essentially 100% equity (zero bank debt; IFRS 16 lease liabilities RMB 3,728 million not financial debt). Central WACC: 11.5% base / 10.5% bull / 12.5% bear.
Capex and FCF anchors364365: FY2025 capex RMB 1,172 million (3.2% of revenue); capex/D&A 1.05x. FY2025 FCF estimated RMB 11.5-12.8 billion (margin ~31-34%); FCF yield at current price ~6.3%. H1 2026 FCF RMB 2,913 million (annualized ~RMB 5,826 million).
Assumption | Bear (Deutsche Bank) | Base (Consensus/UBS) | Bull (Re-rating) |
|---|---|---|---|
FY2026E Revenue (RMB B) | ~35 (-6% YoY) | ~37-38 (0-2%) | ~39 (+5%) |
FY2027E Revenue Growth | +0 to +3% | +15% | +25% |
FY2028E Revenue Growth | +5% | +18% | +22% |
Gross Margin (avg FY26-28) | 66-68% | 68-70% | 70-72% |
FCF Margin (terminal) | 25-28% | 30-33% | 33-38% |
Terminal Growth Rate | 4% | 6-7% | 8-9% |
WACC | 12.5% | 11.5% | 10.5% |
DCF Intrinsic Value (HKD) | ~105-115 | ~155-175 | ~225-260 |
WACC sensitivity (base recovery, 12% 5yr CAGR, 4% terminal growth):
WACC | Implied Value (HKD) |
|---|---|
8% | ~210 |
10% | ~165 |
11.5% | ~155-175 |
12% | ~130 |
14% | ~105 |
Key Finding 4: Peer Multiple Cross-Check
EV/EBITDA method using LTM EBITDA ~RMB 15.7 billion, ~RMB 14 billion net cash, 1,326 million shares:366
EV/EBITDA Multiple | EBITDA Base | Implied Equity Value (RMB B) | Per Share (HKD) |
|---|---|---|---|
7x (Mattel-like floor) | CNY 12B | ~98B | ~82 |
9x (current trough) | CNY 12B | ~122B | ~103 |
9x (recovery) | CNY 15B | ~149B | ~125 |
12x (mid-cycle peer) | CNY 12B | ~158B | ~133 |
12x (recovery) | CNY 15B | ~194B | ~163 |
17x (Sanrio-equivalent) | CNY 15B | ~269B | ~226 |
20x (GAW-equivalent) | CNY 15B | ~314B | ~264 |
P/E cross-check on FY2026E EPS range367 (HKD; add ~HKD 11.7 net cash separately):
FY2026E EPS (HKD) | 10x | 12x | 15x | 18x | 22x |
|---|---|---|---|---|---|
7.5 (ultra-bear) | 75 | 90 | 113 | 135 | 165 |
9.0 (bear/Deutsche Bank) | 90 | 108 | 135 | 162 | 198 |
10.5 (base) | 105 | 126 | 158 | 189 | 231 |
12.5 (bull) | 125 | 150 | 188 | 225 | 275 |
Current HKD 153.50 implies ~14.6x on bear-case EPS of HKD 10.5 — limited cushion if deeper earnings disappointment materializes.
Key Finding 5: Entry Price Framework — Tiered Margin of Safety
Tier | Scenario | Intrinsic Value (HKD) | MoS Required | Target Entry Price (HKD) | Status vs. HKD 153.50 |
|---|---|---|---|---|---|
Tier 1 — Momentum | Bull case | 233-263 | 15-20% | 187-223 | Above current — no MoS |
Tier 2 — Fair Value Zone | Base case | 151-193 | 20% | 121-154 | Current price at low end; 0-21% MoS |
Tier 3 — Conservative Entry | Base + buffer | 151-193 | 30% | 106-135 | Requires 12-31% further decline |
Tier 4 — Bear Priced In | Bear case | 104-123 | 15% | 88-105 | Requires 32-43% further decline |
Tier 5 — Cash + Trough EPV | Net cash + trough | 85-100 | 10% | 76-90 | Requires 41-50% further decline |
HKD 140-155 (current zone): Market prices base case with minimal buffer. No margin of safety to bear case. Consistent with UBS: "current valuation partially prices in risks."
HKD 120-135 (Tier 3): 30% discount to base case intrinsic value; ~50-55% discount to bull case. At HKD 125, EV/EBITDA implies ~9x on recovery EBITDA — the zone where high-ROIC cyclicals with net cash typically find durable buyers.
HKD 100-120 (Tier 3/4 boundary): At HKD 110, ~10.5x PE on bear-case earnings while holding ~HKD 11.7/share net cash. Effectively buys earnings power at 8-9x trough multiple — Mattel-level multiples applied to a 70%+ gross margin, zero-debt business.
Key variable sensitivity368:
Variable | Base | Upside | Downside | Per-Share Impact (HKD) |
|---|---|---|---|---|
FY2026 adj. net profit | CNY 11-12B | CNY 14.3B (consensus) | CNY 11B (Deutsche Bank) | +/-30-40 |
FY2027 overseas revenue | Flat/modest | +15-20% YoY | -5% YoY | +/-25-35 |
Applied PE multiple | 14-15x | 20-22x | 10-12x | +/-50-70 |
Net cash (post-buyback) | RMB 14B | RMB 10B | RMB 14B | +/-5-7 |
Gross margin | 69.7% | 71-72% | 67-68% | +/-15-25 |
The multiple re-rating variable (PE 14x to 18-22x) dominates all other assumptions — the primary investment thesis is about whether Pop Mart earns an IP-platform multiple over a 3-5 year horizon, not about near-term earnings precision.
Key Finding 6: The Sanrio Re-Rating Path and IP Optionality
Sanrio's re-rating from ~10x PE (2019-2021) to ~26.5x PE (August 2026) was driven by IP diversification (Hello Kitty now only 37% of revenue), global licensing expansion (ROE 41%), and operating leverage from the pure-licensing model.359 FY2026 operating profit JPY 79.3 billion (+48.4%); FY2027 guidance JPY 89.5 billion (+15%) — recurring, durable, licensing cash flows.
Pop Mart's IP market values remain orders of magnitude below established global IPs: MOLLY ~USD 625 million cumulative (8 years), SKULLPANDA ~USD 400 million, vs. Hello Kitty USD 89 billion.369 STAR MICE scaled to RMB 2.65 billion (+581% YoY in H1 2026) — first evidence of a second major IP forming.370 Labubu concentration declined from 50%+ to ~25%.
At Sanrio-equivalent 17x EV/EBITDA on CNY 15 billion recovery EBITDA: implied ~HKD 226/share. At GAW-equivalent 20x: ~HKD 264/share. These represent the bull scenario, requiring both earnings recovery and structural re-rating — not base case outcomes.
Short-Term and One-Off Factor Isolation
Item | H1 2026 (RMB M) | H1 2025 (RMB M) | Nature |
|---|---|---|---|
FX (loss) / gain | (720.3) | +120.1 | Non-operational, unhedged; retained in Non-IFRS |
Government grants | +239.5 | +37.8 | Non-recurring at elevated scale; correct figure is RMB 239.5 million (NOT RMB 24 billion — a 100x magnitude error was found and corrected)361 |
SBC | (55.5) | (27.9) | Excluded in Non-IFRS |
JV remeasurement gain | 0 | +42.2 | H1 2025 one-time only |
Inventory build | 201 days | ~83 days | Overseas pre-stocking; management states normalization from July 2026 onward |
Information Sources, Limitations, and Confirmed Corrections
Primary files used: H1 2026 Interim Results (file 247933), FY2025 Annual Results (file 130794), Citi Initiation Dec 2024 (file 243571), Disney 10-K FY2025 (file 89308), Mattel 10-K FY2025 (file 117777), MINISO 20-F FY2025 (file 137676).
Web-sourced data: StockAnalysis, Multiples.vc, MarketScreener, BigGo Finance, Quartr (all as of Aug 17, 2026). Sanrio and Games Workshop have no local company spaces — all data from internet research only.
Information limitations: H2 2026 actuals not yet available (Q3 update expected Oct 2026); forward consensus EPS by year (2027E, 2028E) behind paywall; beta estimated from comparables; Pop Mart outbound licensing revenue negligible and not separately disclosed.
Confirmed data corrections from upstream reconciliation:
Government grants H1 2026: RMB 239.5 million (not RMB 24 billion — 100x error corrected)361
Non-IFRS: excludes SBC only; FX losses are RETAINED
Net cash filing-verified: ~HKD 15.8 billion (web source HKD 15.99 billion within 1%)
Wiki card error: H1 2025 JV gain stated as "4.2亿元" in SSOT; primary filing confirms RMB 42 million (factor-of-10 error in wiki)